Welcome to Geotech!
What is ERT Equipment? A Deep Dive into Electrical Resistivity Tomography Technology
TIPS:Electrical Resistivity Tomography (ERT) equipment has become essential for modern subsurface investigations. This comprehensive guide explains how high-density electrical methods work and why they outperform traditional geophysical techniques. Learn about electrode configurations, 3D imaging capabilities, and practical applications across civil engineering, environmental monitoring, and mineral exploration. Discover how electrical resistivity tomography equipment delivers 1,500-meter penetration depth without drilling, and explore the Geotech GIM Series for professional-grade resistivity imaging solutions.

Ⅰ. Understanding ERT Equipment: From Basics to Advanced Applications
Electrical Resistivity Tomography (ERT) equipment represents a paradigm shift in subsurface investigation technology. Unlike conventional drilling methods that disrupt the environment, modern resistivity imaging systems create detailed underground maps without moving a single shovel of soil. This guide explores how high-density electrical methods work, why they matter, and how to select the right system for your project.
Ⅱ. How ERT Equipment Works: The Physics Behind the Technology
1. Core Principles of Electrical Imaging
ERT operates on a simple yet powerful principle: different geological materials conduct electricity differently. Clay layers might show resistivity values below 10 Ω·m, while granite bedrock could exceed 10,000 Ω·m. This contrast allows electrical imaging equipment to distinguish subsurface features with remarkable clarity.
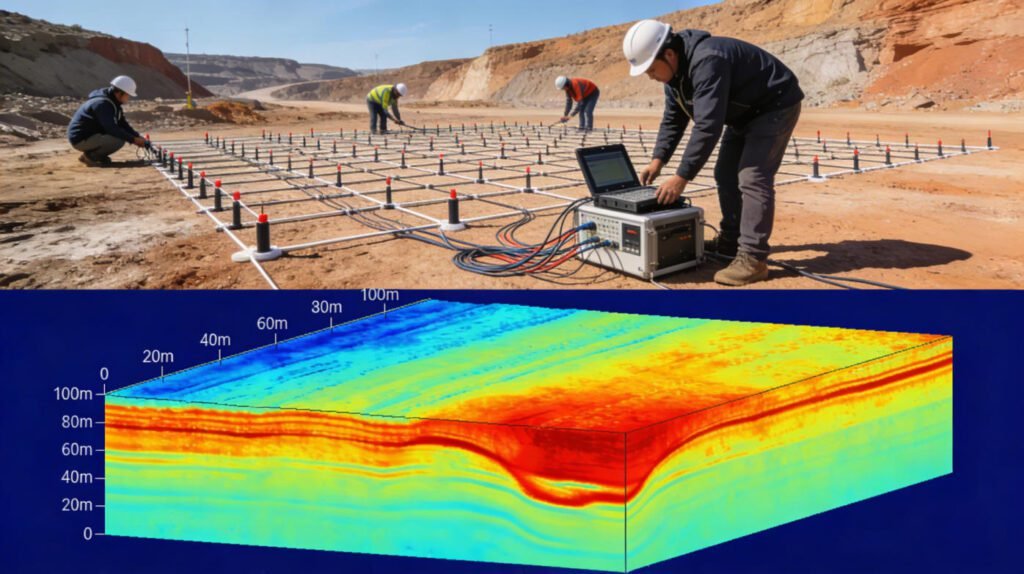
The measurement process involves three key steps:
- Current injection: A transmitter sends controlled DC current into the ground through paired electrodes
- Potential measurement: Receiving electrodes capture voltage differences across the survey area
- Data inversion: Specialized algorithms convert raw measurements into visual resistivity models
Modern DC resistivity sounding systems achieve vertical resolutions of 0.1 meters at shallow depths. This precision makes them invaluable for engineering applications where detail matters.
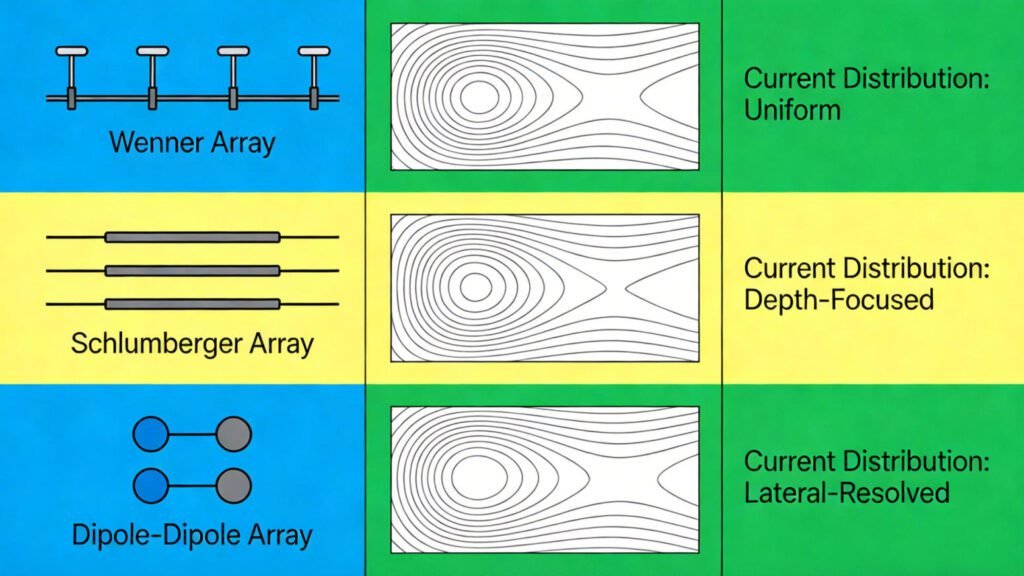
2. Electrode Configurations and Array Types
The choice of electrode array significantly impacts survey outcomes. Here are the primary configurations used in 2D and 3D electrical resistivity imaging methods:表格
复制
| Array Type | Best For | Depth Range | Resolution |
|---|---|---|---|
| Wenner | Horizontal layering | 10-200m | Moderate |
| Schlumberger | Deep sounding | 50-500m | Good |
| Dipole-Dipole | Vertical structures | 20-300m | High |
| Gradient | Large area coverage | 30-400m | Variable |
Ⅲ. ERT vs. Other Geophysical Methods
1. ERT vs. Ground Penetrating Radar (GPR)
While GPR uses electromagnetic waves, electrical resistivity tomography equipment relies on DC current flow. This fundamental difference creates distinct advantages:
- Depth penetration: ERT reaches 1,500m in favorable conditions; GPR typically limits to 30m
- Conductivity tolerance: ERT performs well in clay-rich soils where GPR signals attenuate rapidly
- Quantitative output: ERT provides actual resistivity values; GPR offers relative reflection profiles
2. ERT vs. Seismic Methods
Seismic surveys measure elastic wave velocities. Resistivity imaging measures electrical conductivity. For comprehensive site characterization, engineers often combine both approaches. ERT excels at locating groundwater, while seismic methods reveal rock mechanical properties.
Ⅳ. Advanced ERT Technologies
1. High-Density Electrical Method Innovations
The high-density electrical method has revolutionized field efficiency. Traditional surveys required manual electrode movement between measurements. Modern systems feature:
- Automated switching: Intelligent cables connect 60-120+ electrodes simultaneously
- Rolling acquisition: Continuous data collection during electrode array expansion
- Multi-array synthesis: Single survey combines Wenner, Schlumberger, and Dipole-Dipole configurations
These innovations reduce field time by 70% while improving data density by 400%.
2. Induced Polarization (IP) Integration
IP-capable ERT equipment measures both resistivity and chargeability. This dual-parameter approach distinguishes between:
- Metallic ores (high chargeability, variable resistivity)
- Clay layers (low chargeability, low resistivity)
- Clean aquifers (low chargeability, high resistivity)
Applications include mineral exploration, environmental contamination mapping, and geothermal reservoir characterization.
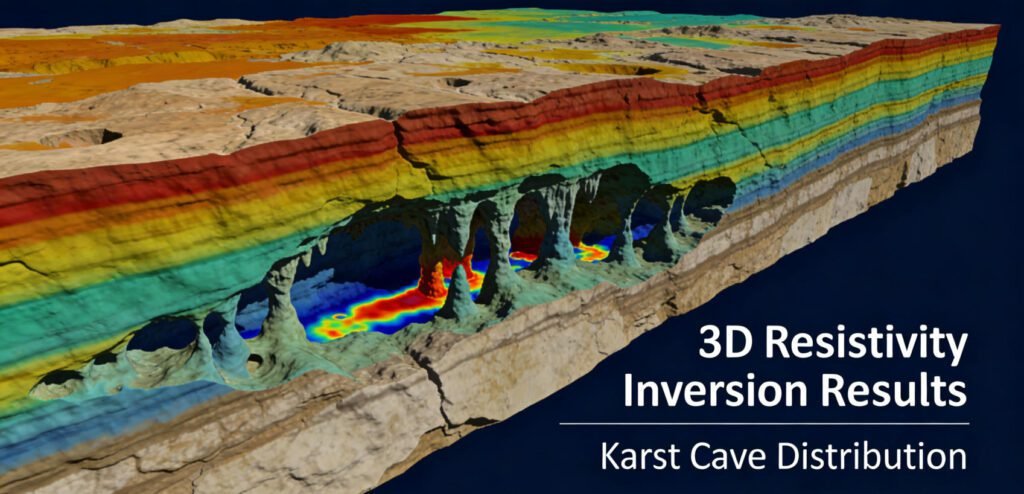
3. 3D Resistivity Imaging
While 2D profiles provide cross-sectional views, 3D electrical resistivity imaging methods create volumetric models. This capability proves essential for:
- Complex karst terrain mapping
- Mine planning and void detection
- Landfill monitoring and leak detection
Ⅴ. Practical Applications Across Industries
1. Civil Engineering and Infrastructure
ERT supports critical infrastructure projects worldwide:
- Road construction: Mapping bedrock topography and weakness zones (Abu Dhabi case study)
- Tunnel engineering: Advance geological prediction and stability assessment
- Dam safety: Seepage pathway identification and integrity monitoring
2. Environmental Science
Vertical electrical sounding (VES) and ERT techniques track:
- Contaminant plume migration in industrial sites
- Landfill liner integrity and leachate detection
- Saltwater intrusion in coastal aquifers
3. Mineral Exploration
Induced polarization (IP) combined with resistivity data targets:
- Porphyry copper deposits
- Gold-bearing structures
- Sulfide ore bodies
Ⅵ. Data Processing: From Raw Measurements to Geological Insights
1. Forward Modeling for Survey Design
Before fieldwork begins, forward modeling simulates expected responses. Engineers input hypothetical geological models and calculate theoretical data. This process optimizes electrode spacing and array selection, ensuring adequate resolution for target depths.
2. Inversion Algorithms and Software
Data inversion transforms measured potentials into resistivity distributions. Modern software packages like RES2DINV, EarthImager, and Geotech’s proprietary solutions offer:
- Smoothness-constrained inversion: Ideal for layered geological settings
- Robust inversion: Handles noisy data from challenging terrains
- Time-lapse inversion: Tracks resistivity changes for monitoring applications
Ⅶ. Selecting the Right ERT System
1. Key Specifications to Evaluate
When choosing electrical resistivity tomography equipment, consider:
- A/D resolution: 24-bit minimum for professional surveys
- Channel count: 10 channels for small projects; 60+ for 3D surveys
- Power output: Higher voltage (800V+) enables deeper penetration
- IP functionality: Essential for mineral exploration and environmental work
2. Geotech GIM Series: Professional-Grade Solution
The GIM Series High-Density Resistivity and IP Testing System delivers exceptional performance:
- Multi-function integration: Natural potential, 1D/2D/3D resistivity, and IP measurements
- Deep penetration: 1,500m investigation depth with cascading technology
- Rugged design: IP67 waterproof rating; -20°C to +60°C operating range
- Efficient acquisition: 10-channel synchronous measurement with rolling mode
- Software compatibility: Exports to industry-standard inversion platforms
Ⅷ. Conclusion
Electrical Resistivity Tomography (ERT) has evolved from a niche geophysical technique to an essential tool across multiple industries. The shift from single-channel devices to high-density electrical systems has democratized access to high-quality subsurface imaging. By understanding the principles, methods, and applications outlined in this guide, professionals can leverage resistivity imaging technology to make informed decisions, reduce risks, and optimize project outcomes.
Whether investigating groundwater resources, assessing infrastructure stability, or exploring mineral deposits, modern ERT equipment provides the clarity needed to see beneath the surface. As technology continues advancing—incorporating AI-driven inversion, IoT connectivity, and autonomous data collection—the future of subsurface exploration looks brighter than ever.
Estimated reading time: 7 minutes
References
- E. M. Purcell, H. C. Torrey, and R. V. Pound: Phys. Rev. 69 (1946) 37. https://journals.aps.org/pr/abstract/10.1103/PhysRev.69.37
- F. Bloch: Physica 17 (1950) 460. https://journals.aps.org/pr/abstract/10.1103/PhysRev.70.460
- H. Dong, H. Liu, J. Ge, Z. Yuan, and Z. Zhao: IEEE Trans. Instrum. Meas. 65 (2016) 898. https://ieeexplore.ieee.org/document/7393816
- G. S. Waters: Nature 176 (1955) 691. https://www.nature.com/articles/176691a0
- G. S. Waters and G. Phillips: Geophys. Prospect. 4 (1956) 1. https://onlinelibrary.wiley.com/doi/10.1111/j.1365-2478.1956.tb01392.x
- A W. Overhauser: J. Phys. Rev. 92 (1953) 411. https://journals.aps.org/pr/abstract/10.1103/PhysRev.92.411
- A. Abragam: J. Phys. Rev. 98 (1955) 1729. https://journals.aps.org/pr/abstract/10.1103/PhysRev.98.1729
- G. Breit and I. I. Rabi: J. Special Studies Papers 38 (1931) 2082. https://journals.aps.org/pr/abstract/10.1103/PhysRev.38.2082.2
- I. Solomon: J. Phys. Rev. 99 (1955) 559. https://journals.aps.org/pr/abstract/10.1103/PhysRev.99.559
- J. Lenz and S. Edelstein: IEEE Sens. J. 6 (2006) 631. https://ieeexplore.ieee.org/document/1634415
- N. Kernevez and H. Glenat: IEEE Trans. Magn. 27 (2002) 5402. https://ieeexplore.ieee.org/document/278852
- D. Duret, J. Bonzom, M. Brochier, M. Frances, J. M. Leger, R. Odru, C. Salvi, T. Thomas, and A. Perret: IEEE
Trans. Magn. 31 (1995) 3197. https://ieeexplore.ieee.org/document/490326