Welcome to Geotech!


What is Electrical Imaging? ERT, VES & Applications Guide
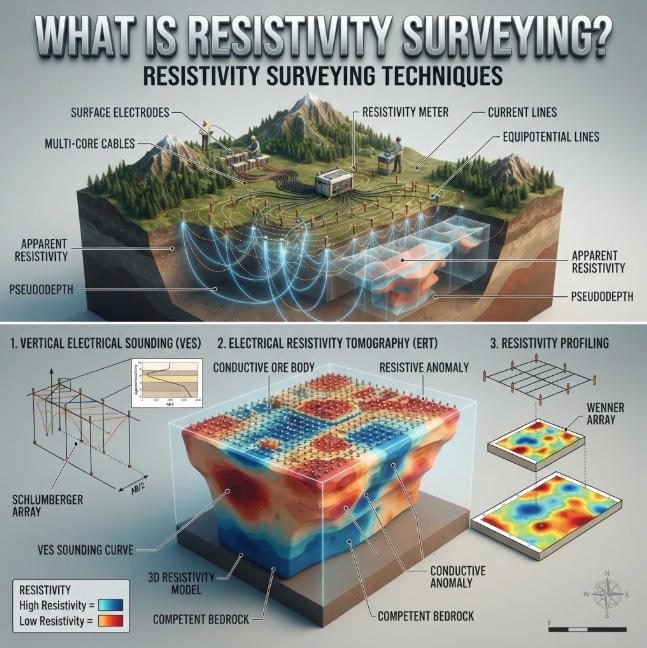
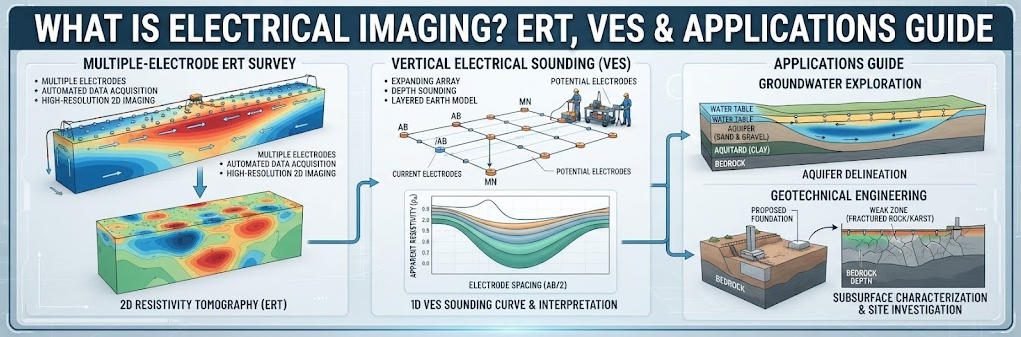
Overview:Electrical Imaging uses measured electrical responses to build a model of subsurface resistivity. Electrical Resistivity Tomography (ERT) extends this principle into 2D or 3D imaging, while Vertical Electrical Sounding (VES) focuses on resistivity variation with depth at a selected location. Electrical Imaging is therefore not a single acquisition geometry. It is a broader resistivity-based investigation approach. ERT and VES should be selected according to the geological question, target geometry, expected resistivity contrast and required spatial coverage.
Ⅰ. Definition and Fundamental Principles
1. Core Definition
Electrical imaging is a non-invasive geophysical technique based on Ohm’s Law that maps subsurface resistivity distribution. It injects controlled electrical currents into the ground and measures resulting potential differences at the surface. Inversion algorithms convert raw field data into 1D, 2D, 3D or time-lapse 4D resistivity models. Different subsurface materials exhibit characteristic resistivity values based on their electrical conductivity.
High-resistivity materials such as air, dry sand and intact bedrock conduct electricity poorly. Low-resistivity materials including clay, saturated soil, groundwater and mineralized zones conduct electricity readily. Resistivity values correlate directly with lithology, porosity, saturation degree and pore fluid chemistry. This relationship enables electrical imaging to identify aquifers, fractures, cavities and lithological boundaries.
2. Physical Principle and Measurement Theory
The measurement principle follows Ohm’s Law: V = I × R, where V is voltage, I is current and R is resistance. A four-electrode configuration eliminates contact resistance errors from measurement results. Two outer current electrodes inject current into the subsurface, while two inner potential electrodes measure voltage drop. Apparent resistivity is calculated from measured resistance using a geometric factor based on electrode spacing.
Apparent resistivity represents a weighted average of all materials within the current flow volume. It differs from true formation resistivity because the subsurface is never perfectly homogeneous. Inversion processing iteratively adjusts subsurface resistivity models to match observed surface measurements. Advanced inversion algorithms produce realistic subsurface resistivity distributions for geological interpretation.
3. Dimensionality of Electrical Imaging
Electrical imaging surveys are deployed in four dimensional configurations depending on project objectives. Each configuration delivers different spatial coverage, resolution and depth capability.
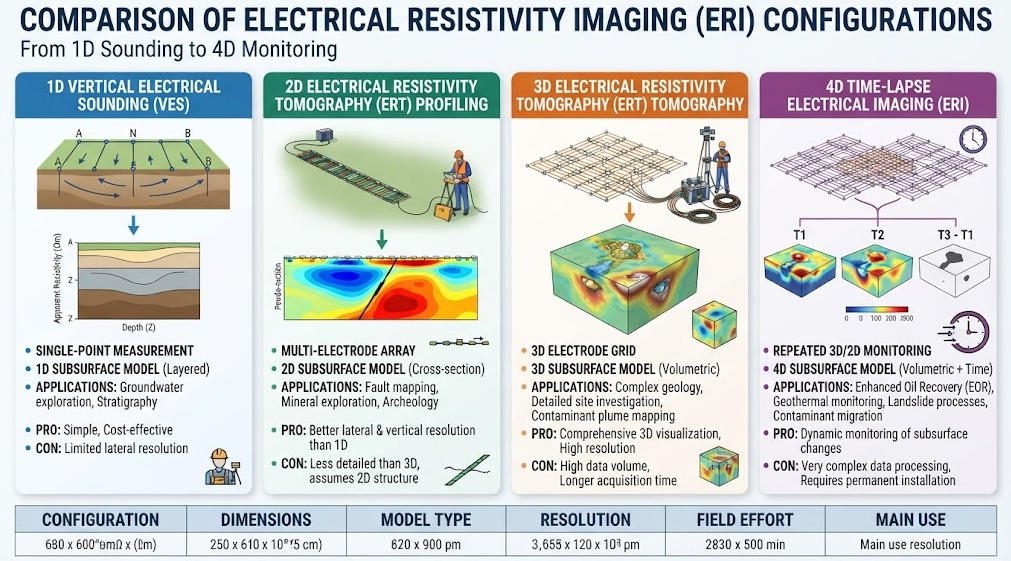
| Configuration | Dimensionality | Output Format | Primary Application Scenario |
|---|---|---|---|
| Vertical Electrical Sounding (VES) | 1D | Resistivity vs. depth curve | Point depth profiling, aquifer reconnaissance |
| 2D Resistivity Profiling | 2D | Cross-sectional resistivity slice | Linear survey corridors, fault mapping |
| 3D Resistivity Tomography | 3D | Volumetric resistivity block | Detailed ore body modeling, dam monitoring |
| 4D Time-Lapse ERT | 3D + time | Time-series 3D models | Plume tracking, seepage monitoring |
1D VES provides depth-dependent resistivity information at a single survey point. It is the simplest and most cost-effective configuration for vertical stratigraphy characterization. 2D profiling generates cross-sectional images along survey lines for linear feature detection. 3D tomography produces full volumetric models for complex subsurface targets. 4D time-lapse imaging tracks temporal changes in subsurface conditions over repeated surveys.
Ⅱ. Key Electrode Array Configurations
1. Common Array Types and Performance
Electrical imaging uses various electrode array configurations to optimize for different objectives. Each array has characteristic sensitivity patterns, depth capabilities and noise immunity.
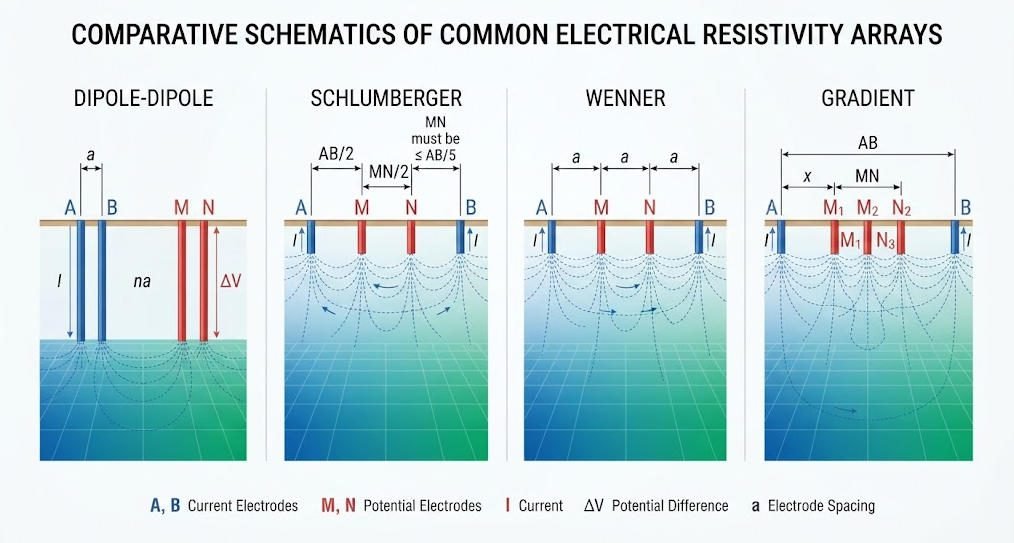
| Array Type | Signal Strength | Lateral Resolution | Vertical Resolution | Primary Strength |
|---|---|---|---|---|
| Dipole-Dipole | Low | Excellent | Moderate | High lateral resolution for structure mapping |
| Schlumberger | Medium | Moderate | Good | Deep vertical sounding with few electrodes |
| Wenner | High | Poor | Excellent | Strong signal for noisy urban environments |
| Gradient | Medium | Good | Moderate | Multi-channel data acquisition efficiency |
2. Dipole-Dipole Array
The dipole-dipole array separates current and potential dipoles by increasing distances. It delivers the highest lateral resolution of all standard configurations. This array is particularly sensitive to steeply dipping structures, faults and cavity boundaries. Its main limitation is rapid signal decay with depth, reducing deep penetration capability.
3. Schlumberger Array
The Schlumberger array maintains fixed potential electrodes while expanding current electrode spacing. It achieves greater depth penetration with fewer total electrodes than Wenner configurations. This array is the standard for vertical electrical sounding applications. It provides good vertical resolution for layered geological sequences.
4. Wenner Array
The Wenner array uses four equally spaced electrodes in a straight line. It produces the strongest signal strength for a given current injection level. High signal-to-noise ratio makes it ideal for urban and industrial environments with electromagnetic interference. The array offers excellent vertical resolution but limited lateral resolution.
5. Gradient Array
The gradient array places a long current dipole with multiple potential electrodes between them. It supports efficient multi-channel data acquisition with high data density. This configuration offers good noise resistance and balanced resolution performance. It is commonly used for 2D and 3D high-density resistivity imaging surveys.
Ⅲ. Core Method Comparison: ERT vs VES
1. Electrical Resistivity Tomography (ERT)
ERT is an advanced 2D/3D electrical imaging technique that produces high-resolution subsurface models. Modern systems use automated multi-electrode arrays with 48 to 120+ parallel channels. Automated electrode switching enables rapid data collection across hundreds of measurement points.
Effective investigation depth ranges from 5 meters to approximately 300 meters for standard systems. High-voltage systems with 1000V output extend penetration to 500 meters in resistive formations. Depth equals approximately one-fifth to one-third of the total electrode array spread. Lateral resolution ranges from 0.5 to 3 meters depending on electrode spacing.
ConvResNet AI inversion algorithms reduce 3D modeling time from 24 hours to 1.8 hours. This speedup makes large-scale 3D surveys practical for routine engineering and exploration projects. ERT is the preferred method for detailed site characterization, dam monitoring and 3D ore body modeling.
2. Vertical Electrical Sounding (VES)
VES is a traditional 1D electrical imaging technique for depth profiling at single points. It uses expanding electrode arrays to probe progressively deeper subsurface layers. The method produces a curve showing how resistivity changes with depth at one location.
VES offers significantly lower cost and simpler logistics compared to ERT. It requires only four electrodes and basic measurement instrumentation. Maximum depth can reach 800 meters or more with large electrode spreads. The primary limitation is complete absence of lateral resolution capability.
VES remains the standard method for preliminary hydrogeological reconnaissance. It is ideal for regional aquifer mapping and bedrock depth determination. The method is also commonly used for calibration of other geophysical survey data.
3. Side-by-Side Performance Comparison
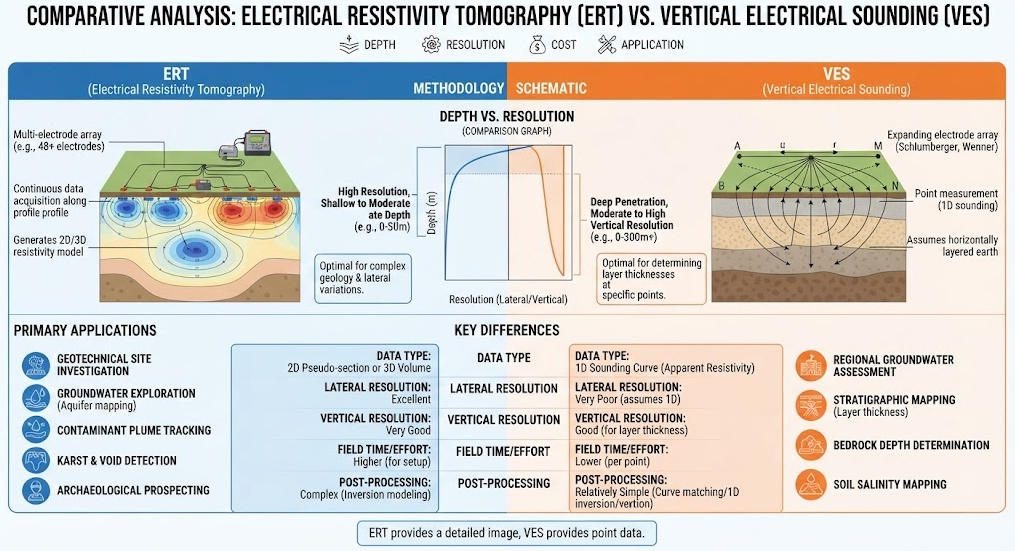
| Parameter | Electrical Resistivity Tomography (ERT) | Vertical Electrical Sounding (VES) |
|---|---|---|
| Dimensionality | 2D / 3D volumetric imaging | 1D depth profile only |
| Typical Depth Range | 5 – 300 m (up to 500m HV) | 20 – 800+ m |
| Lateral Resolution | 0.5 – 3 m | None (single point measurement) |
| Channel Count | 48 – 120+ | 4 |
| Relative Survey Cost | Medium | Very Low |
| Data Acquisition Speed | Moderate (automated) | Slow (manual electrode moves) |
| Primary Advantage | High-resolution imaging of complex structures | Low cost, deep depth capability |
| Best Application | Detailed site characterization, 3D modeling | Regional reconnaissance, layered aquifers |
Ⅳ. Industrial Applications and Field Case Studies
1. Hydrogeological Surveys
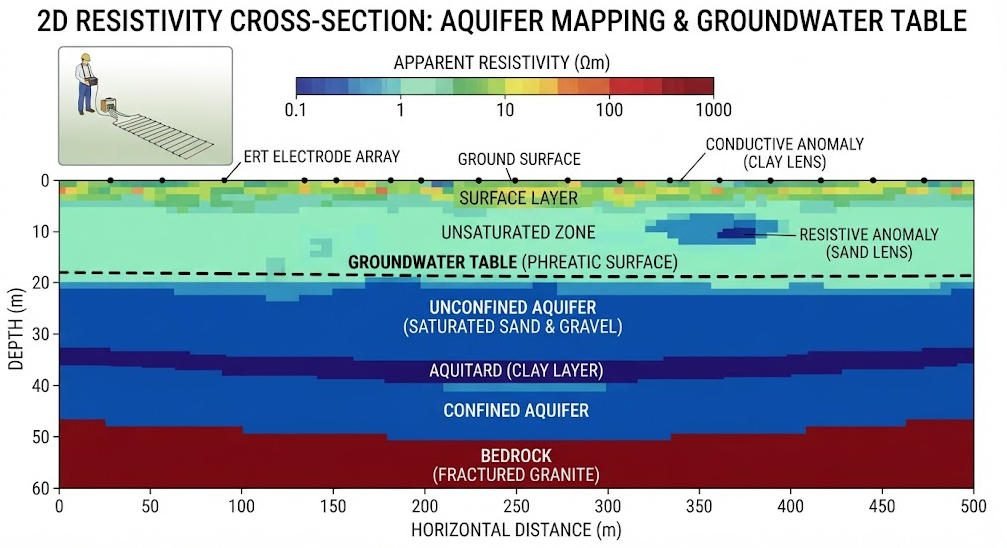
Electrical imaging is a foundational tool for groundwater resource assessment and management. It maps aquifer geometry, determines saturation levels and characterizes groundwater quality. Resistivity contrasts distinguish between fresh water, brackish water and saline groundwater.
In coastal aquifer investigations, electrical imaging maps saltwater intrusion fronts. Time-lapse surveys monitor seasonal changes in freshwater-saltwater interfaces. This information supports sustainable groundwater management and coastal water resource protection.
For arid region groundwater exploration, electrical imaging identifies potential aquifer zones efficiently. Compared to random drilling programs, geophysical targeting significantly improves success rates. Combined with Induced Polarization methods, it also characterizes aquifer mineralogy and water quality.
2. Environmental Monitoring and Remediation
Electrical imaging supports environmental site assessment and long-term monitoring programs. It detects and tracks contaminant plumes without invasive drilling or soil sampling. Conductive contaminants produce distinct low-resistivity anomalies in the subsurface.
In industrial area groundwater pollution monitoring projects, electrical imaging maps plume distribution and migration pathways. Time-lapse ERT tracks plume movement and evaluates remediation effectiveness over time. Combined with GPR for shallow detail, it provides comprehensive data from surface to depth. This integrated approach guides remediation design and verifies treatment performance.
For landfill monitoring, electrical imaging detects leachate plumes and identifies preferential flow paths. Regular time-lapse surveys provide early warning of liner failure and contaminant breakthrough. This protects groundwater resources and reduces environmental liability for operators.
3. Engineering and Geotechnical Applications
Electrical imaging supports civil infrastructure projects through subsurface site characterization. It detects karst cavities, fracture zones and weak layers before construction. The method also monitors ground conditions during construction and over asset lifecycle.
In foundation engineering, ERT maps soil layers and identifies groundwater table position. This information supports foundation design and bearing capacity assessment. For dam safety monitoring, time-lapse ERT tracks embankment core saturation with ±2% accuracy. Regular surveys detect seepage pathways and internal erosion before critical failure develops.
In urban infrastructure projects, electrical imaging detects subsurface voids that cause road collapse. It also maps utility corridors and identifies buried infrastructure. The non-invasive nature minimizes disruption to urban operations during survey.
4. Mining and Mineral Exploration
Electrical imaging supports mineral exploration and mine site hydrogeological assessment. It maps ore bodies through resistivity contrasts with host rock formations. The method also characterizes groundwater conditions around mining operations.
In base metal exploration, 3D ERT models define ore body geometry and structural controls. Silicified ore zones with resistivity above 2000 Ω·m stand out clearly against lower-resistivity host rock. This targeting reduces exploration drilling costs by 30–40% compared to random drilling programs.
For mine safety, electrical imaging maps aquifers that pose water inrush risks. Early detection of water-bearing structures prevents flooding incidents in underground workings. The method also monitors slope stability in open pit mining operations.
5. Agricultural and Soil Applications
Electrical imaging supports agricultural water management and soil characterization. It maps soil moisture distribution and identifies subsurface drainage patterns. This information optimizes irrigation scheduling and improves water use efficiency.
In saline soil areas, electrical imaging maps salinity distribution and tracks remediation progress. It also identifies compacted soil layers that reduce agricultural productivity. The method provides high-resolution data at lower cost than extensive soil sampling programs.
Ⅴ. Comparison with Other Geophysical Methods
1. Cross-Method Performance Matrix
| Method | Physical Property | Depth Range | Lateral Resolution | Ground Contact | Relative Cost | Primary Strength |
|---|---|---|---|---|---|---|
| Electrical Imaging (ERT) | Resistivity | 5 – 300 m | 0.5 – 3 m | Yes (electrodes) | Medium | 2D/3D resistivity imaging |
| Ground Penetrating Radar | Dielectric constant | 0.1 – 30 m | 0.02 – 0.3 m | No | Low | Ultra-high shallow resolution |
| Seismic Refraction | Elastic wave velocity | 5 – 200 m | 2 – 5 m | Yes (geophones) | Medium | Bedrock depth mapping |
| Magnetic Survey | Magnetic susceptibility | Unlimited (source) | 5 – 50 m | No | Very Low | Regional reconnaissance speed |
| TEM | Conductivity | 20 – 800+ m | 5 – 20 m | No | Medium-High | Deep conductive target detection |
2. Method Synergy and Combined Surveys
No single geophysical method delivers optimal performance across all project dimensions. Combining electrical imaging with complementary methods leverages each technique’s strengths. Integrated surveys improve interpretation accuracy and reduce ambiguity.
Electrical imaging combined with GPR provides continuous high-resolution data from shallow to intermediate depth. GPR delivers centimeter-scale detail in the upper 10 meters, while ERT extends to 300 meters. This combination is ideal for urban engineering and karst hazard assessment projects.
Combining electrical imaging with seismic methods provides both hydrogeological and geomechanical data. ERT delivers groundwater and lithology information, while seismic provides stiffness and strength parameters. This integrated approach is standard for comprehensive geotechnical site characterization.
For deep mineral exploration, electrical imaging combined with magnetic and IP methods delivers comprehensive targeting. Magnetic surveys provide rapid regional reconnaissance, while ERT and IP detail specific targets. This tiered approach optimizes exploration efficiency and reduces overall project cost.
Ⅵ. Advantages, Limitations and Mitigation
1. Key Advantages of Electrical Imaging
Electrical imaging offers several unique benefits compared to other geophysical techniques. First, it provides direct measurement of fluid-related properties critical for hydrogeology. Resistivity values directly correlate with porosity, saturation and pore fluid chemistry.
Second, the method supports flexible deployment from 1D soundings to full 3D volumes. Survey design can be optimized for specific project objectives and site constraints. Scalable instrumentation fits both small reconnaissance and large detailed survey programs.
Third, electrical imaging is cost-effective compared to drilling and other geophysical methods. It provides extensive subsurface information at a fraction of the cost of borehole programs. Time-lapse monitoring capability supports long-term asset management with repeatable measurements.
Fourth, the technique is non-invasive and environmentally benign. Electrode installation causes minimal ground disturbance and no permanent impact. This makes it suitable for environmentally sensitive areas and heritage sites.
2. Limitations and Mitigation Strategies
Electrical imaging has limitations that must be understood for effective application. First, data interpretation requires professional geophysical expertise. Complex geological conditions can produce non-unique solutions and interpretation ambiguity. Mitigation: integrate multiple methods and calibrate with available borehole data.
Second, the method is susceptible to electromagnetic interference from cultural sources. Power lines, cables and industrial facilities produce noise that degrades data quality. Mitigation: use high signal arrays (Wenner), digital filtering and stacking techniques.
Third, depth penetration is limited compared to some passive and EM methods. Very deep targets beyond 500 meters require specialized high-power systems. Mitigation: combine with TEM or CSAMT for deeper investigation requirements.
Fourth, resolution decreases exponentially with increasing depth. Deep targets are imaged at lower resolution than near-surface features. Mitigation: design survey layouts with appropriate electrode spacing for target depth.
Ⅶ. GIM Series Electrical Imaging Equipment
1. Core Product Overview
The GIM Series is a multi-functional electrical imaging system designed for field geophysical applications. It integrates natural potential measurement, 1D/2D/3D resistivity tomography and induced polarization capability. The system delivers comprehensive electrical imaging solutions for diverse project requirements.
2. Key Technical Specifications
| Feature | Specification | Performance Benefit |
|---|---|---|
| A/D Conversion | 24-bit high precision | Accurate, reliable data for precise subsurface imaging |
| Maximum Depth | 1,500 m (bi-directional cascading) | Deep aquifer and mineral exploration capability |
| Environmental Rating | IP67 waterproof, -20°C to +60°C | Stable performance in extreme environments |
| Acquisition Channels | 10-channel synchronous | Efficient multi-electrode data capture |
| Data Formats | TXT / Excel export | Compatible with Res2DInv, EarthImager software |
3. Technology and Design Features
High-precision 24-bit analog-to-digital conversion ensures accurate measurement of small potential differences. This high dynamic range delivers reliable data even in high-resistance geological environments. Bi-directional cascading technology overcomes traditional depth limitations of electrical exploration. The system achieves 1,500 meters detection depth for deep aquifer and mineral exploration.
IP67 waterproof rating and wide operating temperature range ensure field reliability. The system performs consistently in hot desert environments and cold mountainous regions. It supports cross-hole, underwater and 3D distributed cable configurations. This versatility suits various complex geological conditions and application scenarios.
10-channel synchronous acquisition with rolling measurement mode improves survey efficiency. Multi-electrode data capture in a single setup reduces on-site working time significantly. Data export in standard formats ensures compatibility with mainstream inversion software packages. This facilitates seamless data processing and analysis by end users.
4. Field-Proven Application Cases
The GIM Series has been deployed successfully across numerous project types worldwide. In groundwater pollution monitoring projects, ERT technology maps contaminant plumes quickly and accurately. This provides critical data support for remediation design and performance verification.
In mining exploration projects, combined ERT and IP methods detect groundwater conditions around ore bodies. This information offers important references for mine planning and water management. The system has also supported numerous hydrogeological investigations in arid regions. It successfully identified productive aquifer zones confirmed by subsequent drilling.
Ⅷ. Future Technology Directions
1. Multi-Method Integration
Further integration of ERT, IP and GPR technologies will deliver more efficient groundwater exploration. Unified platforms will combine multiple measurement types in single survey deployments. This reduces field logistics and improves data consistency across methods.
2. AI-Powered Interpretation
Artificial intelligence and machine learning will enhance automation and accuracy of data interpretation. AI algorithms will reduce human error and accelerate processing of large survey datasets. Automated anomaly detection will enable real-time decision making in field operations.
3. Environmental and Sustainability Focus
Future equipment development will emphasize energy efficiency and environmental compatibility. Lower-power systems and solar-powered field stations will support remote sustainable operations. Eco-friendly electrode materials and deployment practices will minimize environmental impact.
4. Interdisciplinary Collaboration
Deeper collaboration with hydrology, geology and environmental science will advance applications. Integrated modeling approaches will combine geophysical data with hydrological and geological models. This will improve predictive capability for groundwater resource management and hazard assessment.
Related Articles
| Internal Resource | Core Content | Recommended Anchor Text |
|---|---|---|
| https://geotechcn.net/service/electrical-imaging-ert/ | Explains the fundamentals of Electrical Imaging, including how resistivity contrasts are used to visualize subsurface structures and identify groundwater, cavities, geological boundaries, and engineering targets. | Electrical Imaging |
| https://geotechcn.net/service/electrical-resistivity-tomography-a-complete-technical-guide/ | Provides a technical overview of Electrical Resistivity Tomography (ERT), covering resistivity principles, electrode arrays, 2D and 3D imaging, field acquisition, inversion, interpretation, applications, and limitations. | Electrical Resistivity Tomography (ERT) |
| https://geotechcn.net/service/what-is-vertical-electrical-sounding-ves/ | Explains Vertical Electrical Sounding (VES) as a one-dimensional resistivity investigation method, including electrode configuration, apparent resistivity, Schlumberger surveying, layer interpretation, and VES limitations. | Vertical Electrical Sounding (VES) |
| https://geotechcn.net/service/ert-equipment-explained/ | Describes the main components and operating principles of ERT equipment, including current injection, voltage measurement, electrode switching, field acquisition, data processing, and resistivity inversion. | ERT Equipment |
| https://geotechcn.net/service/ert-ip-geophysical-survey-guide/ | Compares Electrical Resistivity Tomography and Induced Polarization while explaining how resistivity and IP measurements can be combined for groundwater, mineral, environmental, and engineering investigations. | ERT and IP Survey |
| https://geotechcn.net/service/what-are-electrical-instruments/ | Introduces electrical geophysical instruments and their roles in resistivity, IP, electrical imaging, and subsurface investigation workflows. | Electrical Geophysical Instruments |
| https://geotechcn.net/service/electrical-resistivity-meter/ | Explains the function of electrical resistivity meters, including current injection, potential measurement, apparent resistivity calculation, and their use in field resistivity surveys. | Electrical Resistivity Meter |
| https://geotechcn.net/service/what-is-resistivity-meters/ | Provides a broader explanation of resistivity meters, their measurement principles, major applications, and considerations for selecting equipment for different geophysical survey requirements. | Resistivity Meters |
| https://geotechcn.net/service/geophysical-exploration-classification/ | Provides an overview of major geophysical exploration methods and explains how electrical, electromagnetic, magnetic, seismic, and radar techniques address different subsurface investigation objectives. | Geophysical Exploration Methods |
| https://geotechcn.net/service/what-is-transient-electromagnetic/ | Introduces the Transient Electromagnetic (TEM) method, explaining electromagnetic induction, subsurface conductivity response, field acquisition, and applications in groundwater and geological exploration. | Transient Electromagnetic (TEM) |
Reference Sources
| Authority Source | URL |
|---|---|
| U.S. Environmental Protection Agency (EPA) — Electrical Resistivity | https://www.epa.gov/environmental-geophysics/electrical-resistivity |
| U.S. Geological Survey (USGS) — Direct-Current Vertical Electrical-Resistivity Soundings in the Lower Peninsula of Michigan | https://pubs.usgs.gov/publication/ofr89244 |
| ScienceDirect — Electrical Resistivity Survey in Soil Science: A Review | https://www.sciencedirect.com/science/article/pii/S0167198704002326 |
| MDPI Geosciences — Deep Electrical Resistivity Tomography for Geophysical Investigations: The State of the Art and Future Directions | https://www.mdpi.com/2076-3263/12/12/438 |
| ScienceDirect — Electrical Resistivity Tomography for Underground Imaging and Object Detection | https://www.sciencedirect.com/science/article/pii/S0141938222000464 |
| Frontiers in Water — Electrical Resistivity Tomography, Electromagnetic Methods and GPR for Groundwater Investigation | https://www.frontiersin.org/journals/water/articles/10.3389/frwa.2025.1636613/full |
| African Journals Online — 2D ERT and VES for Groundwater Prospecting | https://www.ajol.info/index.php/njbas/article/view/319383 |
FAQ
Q1: What is electrical imaging in geophysics?
Electrical imaging is a non-invasive geophysical technique that maps subsurface resistivity by injecting current and measuring surface voltage. Based on Ohm’s Law, it generates 1D to 3D resistivity models. It is widely used for groundwater, environmental and engineering site characterization.
Q2: What is the difference between ERT and VES?
ERT produces 2D/3D resistivity images with 0.5–3m lateral resolution using multi-channel arrays. VES generates only 1D depth profiles at single points with no lateral resolution. ERT suits detailed site characterization; VES is ideal for low-cost regional reconnaissance.
Q3: How deep can electrical imaging surveys detect?
Standard ERT reaches 5–300m, while VES can exceed 800m with large electrode spreads. High-voltage systems extend ERT to 500m, and cascading technology achieves 1,500m. Depth varies with electrode spacing, power and geological conditions.
Q4: Can electrical imaging detect groundwater pollution?
Yes, electrical imaging reliably maps groundwater contaminant plumes through resistivity contrasts. Conductive pollutants produce distinct low-resistivity anomalies. Time-lapse ERT tracks plume migration and monitors remediation effectiveness over time.
Q5: What are the main advantages of electrical imaging?
Electrical imaging directly measures fluid-related properties critical for hydrogeology. It offers flexible 1D to 3D deployment, is cost-effective vs. drilling, and is non-invasive. The method supports time-lapse monitoring for long-term environmental and asset management.