Welcome to Geotech!
-1.png)


Electromagnetic Geophysical Survey: EM Methods Guide 2026
TIPS: Electromagnetic geophysical survey methods offer rapid, non-contact subsurface imaging for environmental and mineral exploration projects. This guide explains how electromagnetic geophysical survey technologies detect buried metal, map aquifers, and characterize contaminated sites. You will learn how to choose between frequency-domain, time-domain, and airborne EM systems. You will also discover how to select the right electromagnetic geophysical survey equipment for your next B2B project. Electromagnetic geophysical survey methods deliver fast data coverage. They also reduce field costs when compared with traditional drilling programs.
Ⅰ. Why Electromagnetic Methods Lead Modern Site Characterization
1. The market shift toward EM surveys
The geophysical services market shows clear growth in electromagnetic surveys. EM surveys now grow faster than seismic methods. Industry reports project a CAGR of 6.87 percent for electromagnetic surveys through 2035. They serve environmental site assessment, groundwater exploration, and critical mineral discovery. Mining companies use airborne EM to cover large tenements quickly. Environmental consultants deploy ground EM to find buried drums and pipelines. The demand for battery minerals like lithium and copper drives new EM investment.
This growth reflects broader industry trends. Clients want faster results. They also want lower costs. EM methods meet both needs. A single airborne survey can replace months of ground work. A ground EM profile can locate utilities without excavation. These efficiencies attract B2B buyers across multiple sectors.
2. Buyers prefer non-contact methods
Electromagnetic methods do not need galvanic contact with the ground. This is a major advantage over resistivity surveys. Crews can work on paved surfaces, frozen ground, or contaminated land. No electrode insertion means faster setup. It also means safer field conditions at hazardous sites. For B2B service providers, this speed translates into higher daily productivity.
Non-contact operation also reduces site preparation. Resistivity surveys need electrode holes. Seismic surveys need geophone spikes. EM surveys need only coil placement. This simplicity cuts mobilization time. It also reduces crew size. A two-person team can operate most ground EM instruments.
3. Cost efficiency at scale
Airborne electromagnetic surveys cover hundreds of square kilometers per day. Ground EM systems profile kilometers of pipeline routes in hours. This efficiency reduces per-hectare costs. Clients receive preliminary results within days. They use these results to focus expensive drilling or excavation on high-priority zones.
The cost savings are substantial. A drilling program might cost fifty thousand dollars per hole. An EM survey might cost five dollars per hectare. The EM survey identifies the best drill locations. It eliminates unnecessary holes. This targeting alone can save projects hundreds of thousands of dollars.
Ⅱ. How Electromagnetic Geophysical Survey Methods Work
1. The physics of EM induction
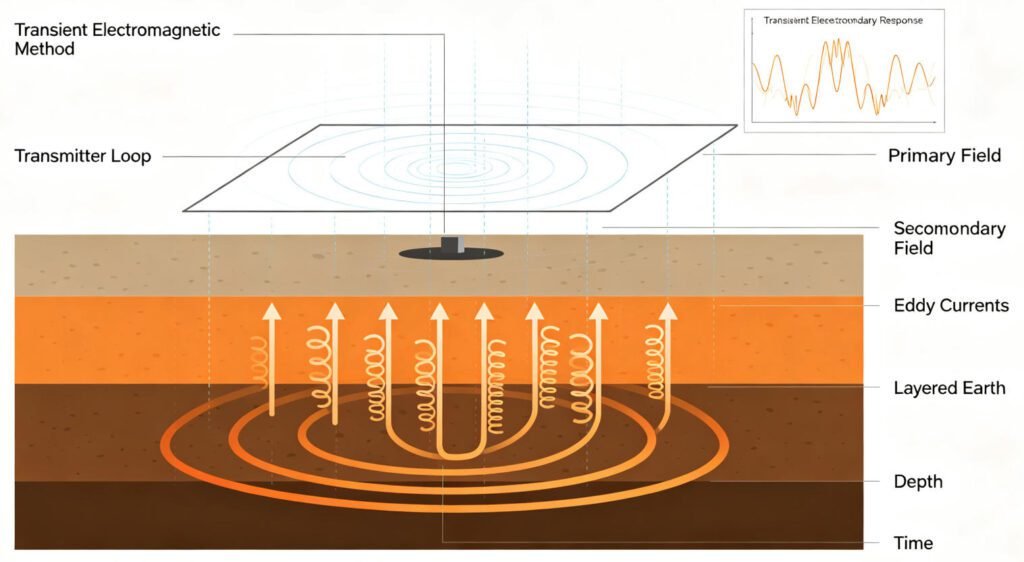
EM methods rely on Faraday’s Law of electromagnetic induction. A transmitter coil generates a primary magnetic field. This field induces eddy currents in conductive subsurface materials. These eddy currents create a secondary magnetic field. A receiver coil measures the combined primary and secondary fields. The ratio between them reveals subsurface conductivity.
Conductive materials include clay, saline water, and metallic ores. Resistive materials include dry sand, fresh bedrock, and hydrocarbon contaminants. The contrast between these materials creates interpretable anomalies. The strength of the anomaly depends on target size, depth, and conductivity contrast.
Skin effect limits penetration depth. Higher frequencies penetrate less. Lower frequencies reach deeper. This principle guides frequency selection. Shallow targets use kilohertz frequencies. Deep targets use hertz frequencies.
2. Frequency-domain vs. time-domain EM
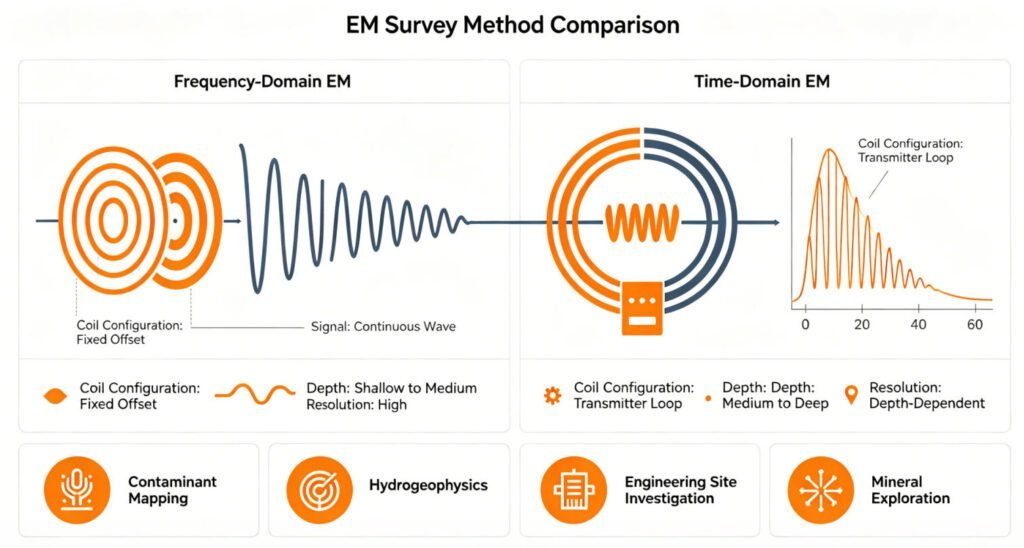
Frequency-domain EM (FDEM) uses continuous sinusoidal current. It measures in-phase and quadrature components at fixed frequencies. FDEM excels at shallow profiling. Instruments like the EM-31 and EM-34 are classic examples. They are lightweight and easy to operate.
FDEM instruments typically use two coils. One transmits. One receives. Coil separation determines depth of investigation. Larger separations probe deeper. Fixed-separation instruments offer rapid data collection. They are ideal for reconnaissance surveys.
Time-domain EM (TEM or TDEM) uses pulsed current. The transmitter shuts off abruptly. The receiver records the decaying secondary field over time. Early-time data reflects shallow layers. Late-time data reflects deeper structures. TEM reaches greater depths than FDEM. It also provides better resolution for layered geology.
TEM systems use various loop configurations. Central-loop TEM places the receiver at the loop center. Offset-loop TEM moves the receiver outside the loop. Each configuration has advantages. Central-loop gives maximum signal. Offset-loop reduces transmitter noise.
3. Airborne, ground, and borehole EM
Airborne EM (AEM) mounts transmitter and receiver coils on aircraft or drones. It covers vast areas rapidly. AEM is standard for regional mineral exploration. It also maps saltwater intrusion along coastlines. Fixed-wing AEM flies at constant altitude. Helicopter AEM follows terrain more closely. This terrain following improves data quality in mountainous regions.
Ground EM uses portable coils or fixed loops. It provides higher resolution than AEM. Ground EM suits detailed site investigations. Walk-through surveys cover small sites. Vehicle-towed arrays cover linear infrastructure. Both approaches offer flexibility.
Borehole EM places sensors in drill holes. It detects ore bodies adjacent to the hole. It also maps conductivity variations at depth. Borehole EM extends investigation beyond the hole wall. This is valuable when surface methods cannot resolve deep targets.
Ⅲ. Key EM Techniques for B2B Applications
1. Very Low Frequency (VLF) EM
VLF EM uses distant military navigation transmitters as the signal source. It measures tilt and ellipticity of the electromagnetic field. VLF detects steeply dipping conductive structures. These include fracture zones, faults, and graphite bands. VLF is cheap and portable. It requires no transmitter. However, it offers limited depth penetration. It also works best when geological strike aligns with transmitter direction.
VLF instruments are popular in developing countries. They need no power-hungry transmitter. They run on small batteries. Field crews can cover long profiles in a day. The main limitation is signal availability. VLF transmitters exist in fixed locations. Some regions have poor signal coverage.
2. Transient Electromagnetic (TEM) Sounding
TEM is the workhorse of deep EM exploration. A large loop transmitter sits on the ground. Current pulses through the loop. A central receiver records decay curves. TEM maps aquifer depth and salinity. It also detects conductive ore bodies. Modern TEM systems use multi-channel receivers. They collect data from multiple locations simultaneously.
TEM resolution improves with advanced processing. Early systems used one-dimensional inversion. Modern systems use two-dimensional and three-dimensional inversion. These advanced methods resolve complex geology. They also reduce interpretation ambiguity.
3. Controlled Source Audio-frequency Magnetotellurics (CSAMT)
CSAMT uses a grounded dipole or loop as the transmitter. It measures orthogonal electric and magnetic fields. CSAMT reaches depths of hundreds to thousands of meters. It maps deep groundwater basins. It also investigates geothermal reservoirs. CSAMT requires more setup than TEM. But it provides superior resolution for layered earth models.
CSAMT is popular in China for geothermal exploration. It also serves oil and gas exploration in some regions. The method needs careful transmitter placement. It also needs good ground contact for the dipole. These requirements add field complexity.
Ⅳ. Application Matrix for Electromagnetic Geophysical Surveys
1. Environmental site assessment
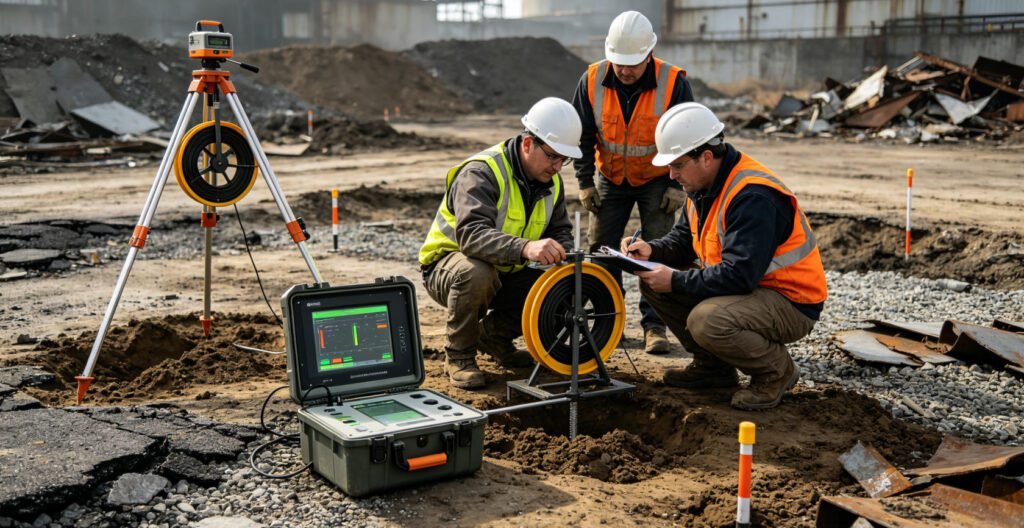
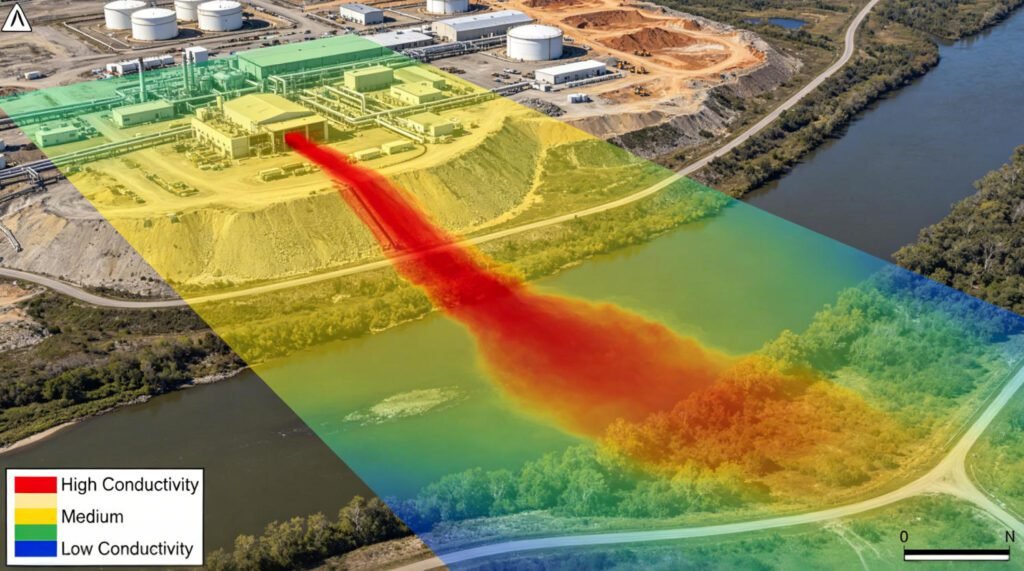
EM surveys locate buried metal objects. These include drums, tanks, and pipelines. They also map landfill boundaries. Conductive leachate plumes show low resistivity. EM detects these plumes without drilling. The EPA recommends EM as a primary screening tool for Superfund sites.
At former industrial facilities, EM identifies underground storage tanks. It traces pipeline corridors. It finds scrap metal that may release contaminants. This information guides soil and groundwater sampling plans. EM also monitors remediation progress. Repeat surveys show plume shrinkage over time.
Brownfield redevelopment projects benefit from EM screening. Developers need to know what lies beneath before construction. EM provides this information quickly. It also reduces liability risks. Knowing tank locations prevents accidental breaches during excavation.
2. Groundwater exploration and management
Freshwater aquifers show moderate conductivity. Saline intrusion creates high conductivity zones. EM maps the freshwater-saltwater interface. This is critical for coastal aquifer management. TEM soundings define aquifer thickness and depth. They also detect clay layers that confine or separate aquifers.
In hard-rock terrains, EM locates weathered zones and fracture networks. These structures host groundwater. AMT and CSAMT methods reach the depths needed for regional aquifer studies. The audio-frequency range penetrates resistive crystalline rock. This makes AMT ideal for basement aquifer exploration.
Agricultural regions use EM for soil salinity mapping. Excess salt reduces crop yields. EM-38 instruments measure near-surface conductivity. Farmers use these maps to plan drainage and leaching. This precision agriculture approach saves water and fertilizer.
3. Mineral and critical raw material exploration
Sulfide ore bodies are highly conductive. They create strong EM anomalies. Airborne EM identifies prospective zones across large areas. Ground TEM follows up on anomalies with detailed soundings. Borehole EM targets ore bodies near existing drill holes.
The energy transition drives demand for copper, nickel, and rare earth elements. EM is the primary tool for discovering these deposits. Battery mineral exploration now accounts for a growing share of EM survey budgets. Graphite deposits also show strong conductivity. EM directly detects these targets.
4. Engineering and infrastructure projects
EM maps bedrock depth for foundation design. It detects cavities in karst terrain. It also locates rebar and utilities in concrete. For road construction, EM identifies soft ground before earthworks begin. For dams, it monitors seepage zones that may threaten stability.
Bridge engineers use EM to assess scour. Riverbed erosion exposes foundations. EM profiles map sediment thickness around piers. This information guides maintenance schedules. It also prevents catastrophic failures.
Ⅴ. Selecting the Right EM Equipment
1. Ground conductivity meters
Instruments like the EM-31 and EM-38 measure apparent conductivity. They operate at fixed frequencies. They are ideal for shallow environmental surveys. The EM-31 reaches about 6 meters depth. The EM-38 reaches about 1.5 meters. These tools are perfect for soil salinity mapping and shallow utility detection.
Modern conductivity meters include GPS integration. They log position with each reading. Post-processing creates conductivity maps automatically. Some instruments offer multiple coil orientations. Vertical dipole mode probes deeper. Horizontal dipole mode offers better lateral resolution.
2. Time-domain EM systems
TEM systems range from portable units to vehicle-mounted rigs. Portable TEM covers depths to 150 meters. Large-loop TEM reaches 500 meters or more. Buyers should consider loop size, transmitter power, and channel count. Multi-channel systems speed up data acquisition. They also improve signal-to-noise ratios.
Transmitter current affects depth and resolution. Higher current produces stronger signals. This improves data quality in noisy environments. Battery capacity limits portable systems. Vehicle-mounted systems use generators. They can deliver hundreds of amperes.
3. Airborne EM platforms
Fixed-wing AEM covers regional scales. Helicopter AEM offers better terrain following. Drone-mounted EM suits small, high-resolution surveys. Platform choice depends on survey area, terrain, and budget. Sensor technology advances now allow AEM to resolve targets at 200 meters depth.
Fixed-wing systems use towed bird configurations. The transmitter and receiver hang below the aircraft. This separation reduces primary field interference. Helicopter systems mount coils on the airframe. This rigid geometry improves data consistency.
Ⅵ. Data Processing and Interpretation
1. From raw data to conductivity models
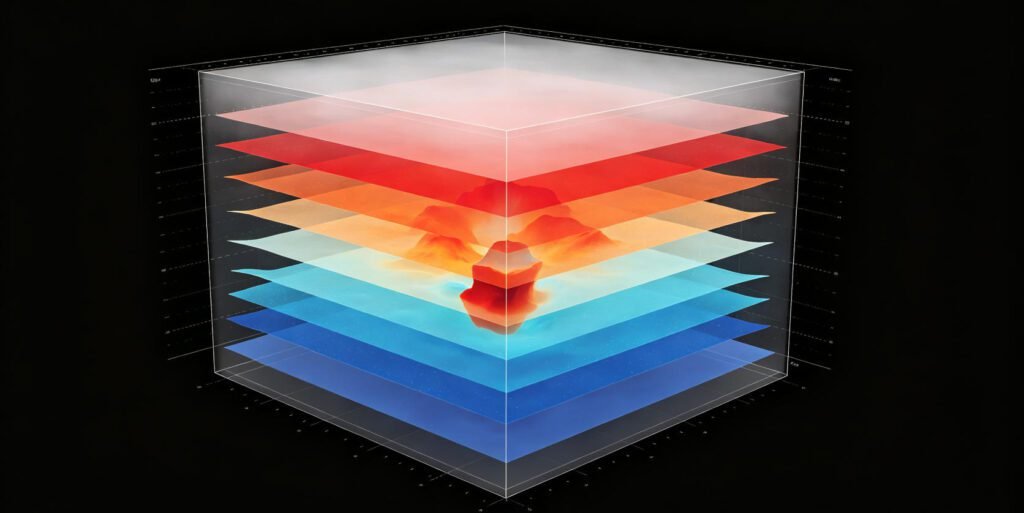
EM instruments output apparent conductivity or decay curves. These raw data need inversion. Inversion software converts measurements into true conductivity-depth profiles. One-dimensional inversion suits layered geology. Two-dimensional inversion handles lateral variations. Three-dimensional inversion is now standard for complex mineral targets.
Inversion algorithms vary in speed and accuracy. Occam inversion seeks the smoothest model. It avoids over-interpretation. Marquardt inversion fits data closely. It may introduce artifacts. Choose the algorithm that matches your geological assumptions.
2. Noise and cultural interference
Power lines, fences, and buildings create EM noise. Data processors must identify and remove these effects. Modern systems use stacking and filtering algorithms. Some instruments record GPS positions. This allows spatial filtering of cultural noise.
Metal fences are particularly problematic. They re-radiate the transmitted field. This creates false anomalies. Processors use phase analysis to distinguish geological signals from cultural noise. Time-domain methods are less affected than frequency-domain methods.
3. Integration with other datasets
EM data alone may not uniquely identify targets. Combine EM with magnetic data to distinguish metal types. Add resistivity data for detailed near-surface imaging. Use gravity data for density contrasts. Multi-method integration reduces ambiguity. It also strengthens final geological models.
Seismic data adds structural control. It reveals fault locations and layer dips. Combine seismic structure with EM conductivity. This fusion produces robust geological interpretations. Many modern projects use three or more methods.
Ⅶ. Field Deployment Best Practices
1. Survey design
Define target depth and expected conductivity before fieldwork. Choose the EM method that matches these parameters. Shallow targets need FDEM. Deep targets need TEM or CSAMT. Large areas need airborne platforms. Small sites need ground instruments.
Line spacing controls lateral resolution. Closer lines detect smaller targets. They also increase survey costs. A common rule is line spacing equals target width. For regional surveys, wider spacing is acceptable. Always design surveys with the end goal in mind.
Station spacing along lines also matters. Dense stations improve data density. They also slow acquisition. Balance density against project timeline. For mineral exploration, stations every 50 meters may suffice. For utility detection, stations every meter may be needed.
2. Calibration and quality control
Calibrate instruments before each survey. Use known test targets to verify response. Record background noise levels. Monitor instrument drift during acquisition. Repeat measurements at check points. Good QC ensures reliable inversion results.
Daily calibration checks catch instrument problems early. A drifting zero point corrupts all subsequent data. Check points at survey start and end verify stability. Some operators add check points every few hours. This vigilance protects data integrity.
3. Safety considerations
Large-loop TEM uses high current. Keep personnel away from energized loops. Airborne surveys need flight clearance. Ground surveys on contaminated sites require PPE. Always follow local safety regulations. EM fields from survey equipment are generally safe. But pacemaker wearers should maintain distance.
High-voltage TEM transmitters pose electrocution risks. Use insulated cables. Mark loop boundaries clearly. Post warning signs. Never touch an energized loop. Turn off power before adjusting cables. These precautions prevent accidents.
Ⅷ. Limitations and Mitigation Strategies
1. Depth and resolution constraints
EM resolution decreases with depth. Shallow layers mask deeper targets. Conductive overburden attenuates signals from below. These effects limit detectability. Use TEM for deep targets. Use borehole EM when surface methods fail.
The skin depth formula quantifies this limitation. Skin depth equals 503 divided by the square root of conductivity times frequency. At 1000 Hz in 100 mS/m ground, skin depth is about 16 meters. Lower frequencies or less conductive ground improve penetration.
2. Non-uniqueness of interpretation
Different geological models can produce identical EM responses. A conductive layer could be clay or saline water. Combine EM with drilling or other geophysical methods. This reduces interpretive risk.
Ambiguity is greatest for one-dimensional soundings. A thick conductive layer looks similar to multiple thin layers. Lateral profiling helps resolve this. Look for consistent trends across multiple soundings. Consistency suggests real geology rather than random noise.
3. Terrain and access challenges
Steep terrain limits airborne survey accuracy. Dense vegetation blocks ground EM access. Paved surfaces prevent loop placement. For these situations, consider drone EM or capacitive resistivity as alternatives.
Mountainous terrain also affects TEM loops. Non-planar loops distort the primary field. Processors must account for loop geometry. Some software includes terrain correction modules. These corrections improve data accuracy in rugged areas.
Ⅸ. Emerging Trends in EM Technology
1. Drone-mounted EM systems
Unmanned aerial vehicles now carry lightweight EM sensors. Drone EM bridges the gap between ground and airborne surveys. It covers areas too small for fixed-wing aircraft. It also reaches terrain too rough for ground crews. Expect drone EM to become standard for site-scale investigations.
Drone EM payloads are improving. Early systems were noisy and limited in depth. Modern systems rival small ground instruments. They offer meter-scale resolution. They also operate below tree canopy in some configurations.
2. Real-time data transmission
Modern EM systems stream data to cloud platforms. Processors monitor data quality in the field. Clients receive preliminary maps within hours. This speed accelerates decision-making. It also allows adaptive survey design.
Adaptive surveys change line spacing based on initial results. If an anomaly appears, operators add infill lines. This targeted approach saves time. It also improves anomaly definition. Real-time processing makes adaptive surveys practical.
3. AI-assisted interpretation
Machine learning algorithms now classify EM anomalies automatically. They identify patterns that human interpreters might miss. AI reduces processing time. It also improves consistency across large datasets.
Neural networks trained on synthetic data recognize anomaly signatures. They distinguish ore bodies from cultural noise. They also estimate depth and conductivity. These estimates guide follow-up drilling. As training datasets grow, AI accuracy improves.
Ⅹ. Conclusion
Electromagnetic geophysical survey methods provide fast, cost-effective subsurface imaging. B2B buyers should match the EM technique to target depth and survey scale. FDEM suits shallow environmental work. TEM handles deeper groundwater and mineral targets. Airborne EM covers regional exploration. Always validate EM results with direct sampling. With proper equipment and workflow, EM surveys deliver reliable data for environmental, groundwater, and mineral projects worldwide.
The technology continues to advance. Drone platforms expand access. Real-time processing accelerates delivery. AI interpretation improves accuracy. Early adopters of these innovations gain competitive advantage in the global geophysical services market. The projected growth of electromagnetic surveys reflects this value. Companies that invest in modern EM capabilities position themselves for long-term success.
Reference Sources
| Organization | Focus Area | URL |
|---|---|---|
| U.S. EPA CLU-IN | EM methods for site characterization | https://clu-in.org/characterization/technologies/default2.focus/sec/Geophysical_Methods/cat/Electromagnetic_Methods/ |
| U.S. Geological Survey (USGS) | Airborne electromagnetic methods | https://www.usgs.gov/mission-areas/water-resources |
| Society of Exploration Geophysicists (SEG) | EM theory and technical standards | https://seg.org/ |
| European Association of Geoscientists & Engineers (EAGE) | Near-surface EM applications | https://www.eage.org/ |
| National Ground Water Association (NGWA) | EM for groundwater exploration | https://www.ngwa.org/ |
FAQ
Q1: What is the difference between EM and resistivity surveys?
A: EM uses induced magnetic fields without ground contact. Resistivity injects direct current through electrodes. EM works on paved or frozen surfaces. Resistivity needs electrode insertion. EM covers large areas faster. Resistivity provides more detailed near-surface imaging. The two methods complement each other.
Q2: How deep can electromagnetic surveys reach?
A: Depth depends on method and frequency. FDEM reaches 6 to 100 meters. TEM soundings reach 150 to 500 meters. CSAMT and AMT reach hundreds to thousands of meters. Airborne EM typically resolves targets to 200 meters. Skin depth limits all EM methods in conductive ground.
Q3: Can EM detect buried tanks and drums?
A: Yes. Metal objects create strong conductivity anomalies. EM-31 and EM-34 instruments are standard for tank detection. They locate buried drums, pipelines, and scrap metal. EM surveys are EPA-recommended for Superfund site screening. They reduce the need for exploratory excavation.
Q4: What is the cost of an EM survey?
A: Ground EM surveys cost $500 to $5,000 per day depending on method and crew size. Airborne EM costs $15,000 to $50,000 per day. Small FDEM instruments start near $8,000 to purchase. TEM systems range from $30,000 to $150,000. Rental options exist for short-term projects.
Q5: Can EM distinguish clay from saline water?
A: Not directly. Both clay and saline water show high conductivity. EM alone cannot separate them. Combine EM with IP surveys to identify clay by its chargeability. Add borehole data for ground truth. Multi-method integration resolves this ambiguity.