Welcome to Geotech!
-1.png)


What Are Electrical and Electromagnetic Equipment in Geophysical Surveys?
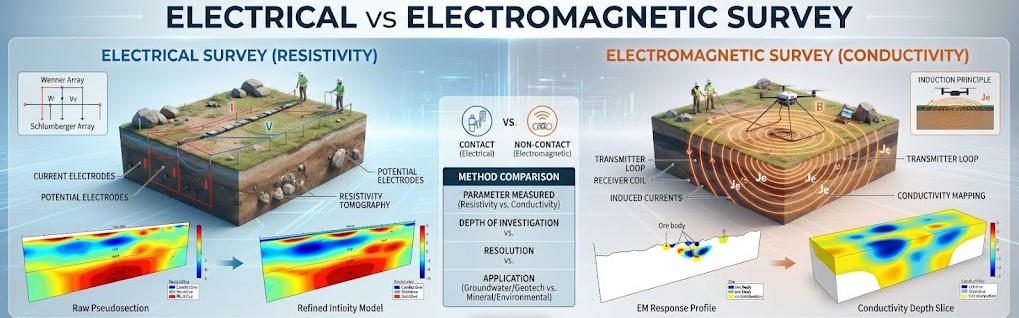
TIPS:This guide compares electrical resistivity survey and electromagnetic geophysical survey methods for modern subsurface exploration. Engineers deploy electrical resistivity survey systems to generate high-resolution 2D and 3D images of groundwater, mineral deposits, and geological hazards. Electromagnetic geophysical survey platforms enable rapid, non-contact data acquisition across vast project areas without electrode insertion. Understanding the technical differences between electrical resistivity survey and electromagnetic geophysical survey helps project teams select optimal geophysical equipment and reduce exploration risk.
Ⅰ. Introduction
1.1 Why Method Selection Matters
Geophysical teams face a critical decision at the start of every project. They must choose between electrical resistivity survey techniques and electromagnetic geophysical survey systems. This choice directly affects data quality, project cost, and field safety. The wrong method wastes budget and delays timelines. The right method delivers actionable subsurface intelligence.
Both techniques measure electrical properties of the ground. Both produce 2D or 3D subsurface models. However, their underlying physics, operational workflows, and ideal use cases differ fundamentally. This guide provides a rigorous, engineer-level comparison. It helps B2B buyers and field geophysicists make evidence-based equipment decisions.
1.2 The Core Physics at Play
Electrical resistivity survey methods inject direct current (DC) into the ground through metal electrodes. The system measures voltage differences between electrode pairs. Ohm’s Law converts these readings into apparent resistivity values. Inversion algorithms then transform raw data into true resistivity models.
Electromagnetic geophysical survey methods use alternating magnetic fields instead. A transmitter coil generates a primary field. This field induces eddy currents in conductive subsurface materials. These currents create a secondary magnetic field. A receiver coil detects the combined primary and secondary fields. The ratio reveals subsurface conductivity.
Ⅱ. How Electrical Resistivity Survey Works
2.1 Current Injection and Voltage Measurement
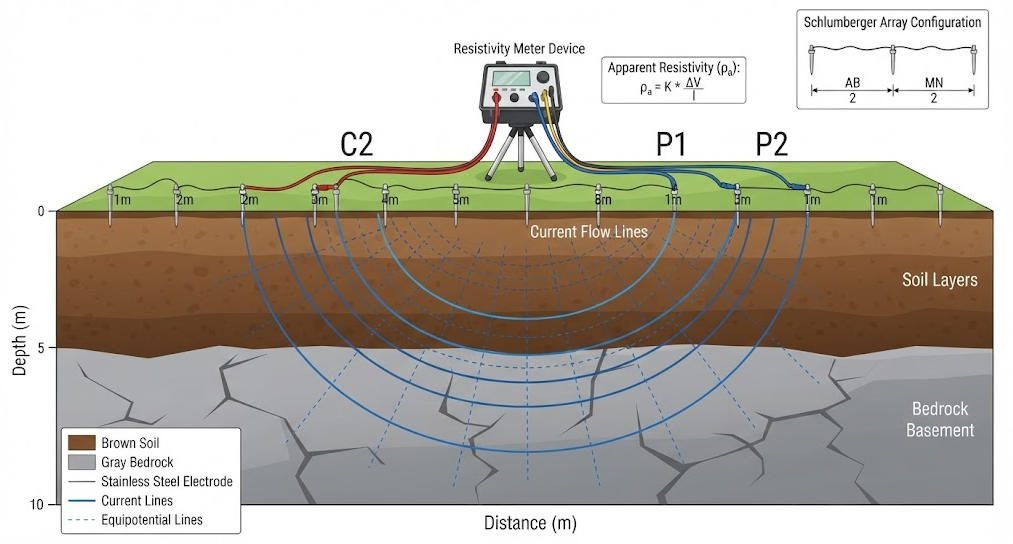
An electrical resistivity survey system requires galvanic contact with the ground. Field crews plant stainless steel electrodes at regular intervals. A resistivity meter injects controlled DC current between two current electrodes. The instrument then measures potential differences between pairs of potential electrodes.
Modern systems use multi-electrode arrays. These arrays contain 60 to 120 electrodes connected by intelligent switching cables. The system automates thousands of four-electrode combinations. This automation produces dense data coverage along a survey line. It eliminates manual electrode repositioning.
2.2 Electrode Array Configurations
Survey design depends on electrode geometry. Three array types dominate industry practice:
- Wenner array: Equal electrode spacing. It offers strong vertical resolution. It works well for layered geology and groundwater mapping.
- Schlumberger array: Variable current electrode spacing. It excels at vertical resistivity sounding. It reaches greater depths than Wenner configurations.
- Dipole-dipole array: Separated current and potential pairs. It provides superior horizontal resolution. It detects vertical fractures and steeply dipping structures.
Array selection determines depth of investigation. It also controls lateral resolution and noise sensitivity. Experienced geophysicists often combine arrays within a single survey.
2.3 2D/3D Resistivity Imaging Output
Data inversion converts apparent resistivity into true resistivity models. 2D inversion generates cross-sectional images. 3D inversion produces volumetric models. These outputs resemble medical CT scans. They reveal groundwater tables, fault zones, karst cavities, and contamination plumes.
High-density electrical resistivity survey systems achieve spatial resolutions below one meter. They distinguish silicified zones from host limestone. They map water-bearing voids at depths exceeding 50 meters. Time-lapse monitoring tracks saturation changes in dam embankments.
Ⅲ. How Electromagnetic Geophysical Survey Works
3.1 Faraday’s Law and Eddy Current Induction
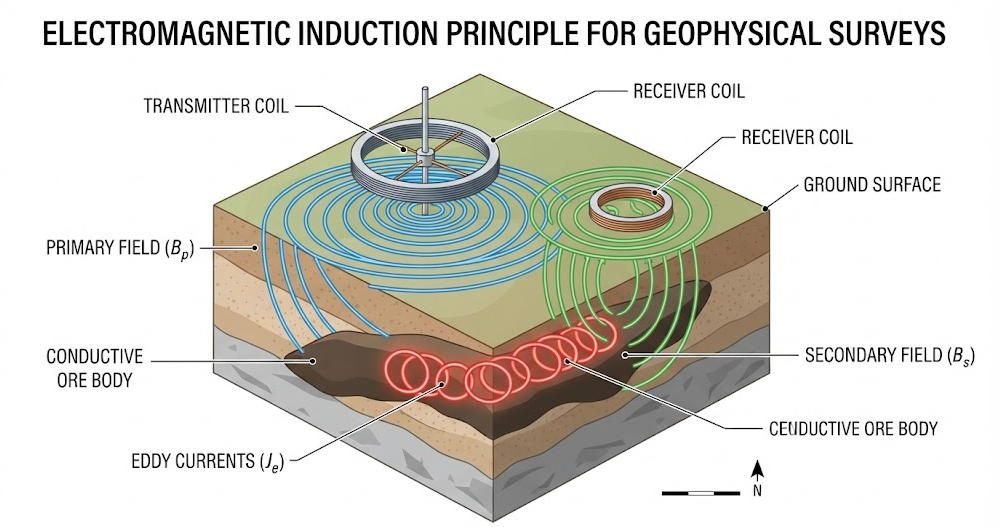
An electromagnetic geophysical survey operates on electromagnetic induction. A transmitter coil carries alternating current. This current generates a time-varying primary magnetic field. The field penetrates the ground and induces eddy currents in conductive bodies.
These eddy currents generate a secondary magnetic field. A receiver coil measures the vector sum of primary and secondary fields. The system records amplitude and phase differences. These differences reveal the conductivity, size, and depth of subsurface targets.
Conductive materials include clay, saline groundwater, and metallic ores. Resistive materials include dry sand, fresh bedrock, and hydrocarbon contaminants. Strong conductivity contrasts produce clear anomalies.
3.2 Frequency-Domain vs Time-Domain Systems
Two main system architectures exist:
Frequency-domain EM (FDEM) uses continuous sinusoidal current. It measures in-phase and quadrature components at fixed frequencies. FDEM instruments like the EM-31 and EM-34 excel at shallow profiling. They are lightweight and easy to operate. Coil separation controls investigation depth.
Time-domain EM (TEM or TDEM) uses pulsed current. The transmitter shuts off abruptly. The receiver records the decaying secondary field over time. Early-time data reflect shallow layers. Late-time data reflect deeper structures. TEM reaches greater depths than FDEM. It also provides better resolution for layered geology.
3.3 Airborne and Ground Deployment Modes
Electromagnetic geophysical survey platforms scale from handheld units to aircraft-mounted systems:
- Ground EM: Portable coils or fixed loops. High resolution for detailed site investigations. Walk-through surveys cover small sites. Vehicle-towed arrays cover linear infrastructure.
- Airborne EM (AEM): Transmitter and receiver coils mounted on aircraft or drones. Covers hundreds of square kilometers per day. Standard for regional mineral exploration.
- Borehole EM: Sensors placed in drill holes. Detects ore bodies adjacent to the hole. Extends investigation beyond the hole wall.
Ⅳ. Direct Technical Comparison
4.1 Contact vs Non-Contact Operation
The most visible difference lies in ground contact. An electrical resistivity survey needs electrode insertion. Crews must penetrate pavement, frozen ground, or rocky terrain. This requirement limits deployment speed. It also creates safety concerns at contaminated sites.
An electromagnetic geophysical survey needs no galvanic contact. Crews can work on paved surfaces, frozen ground, or hazardous land. No electrode holes mean faster setup. Two-person teams can operate most ground EM instruments. This speed translates into higher daily productivity.
4.2 Depth Penetration and Resolution
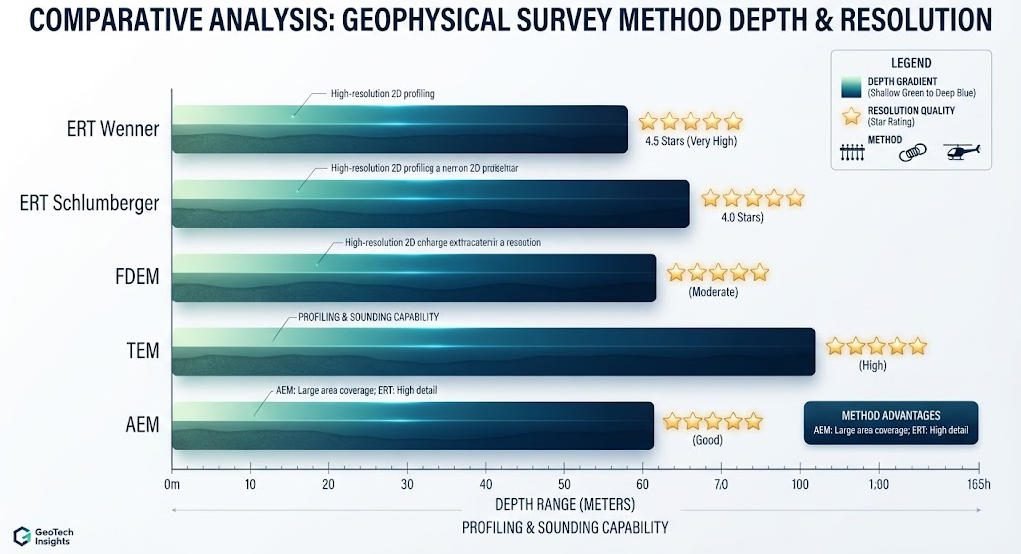
Depth performance varies by method and configuration:
| Method | Typical Depth | Best Resolution | Key Depth Control |
|---|---|---|---|
| ERT (Wenner) | 10–100 m | 0.5–2 m | Electrode spacing |
| ERT (Schlumberger) | 50–300 m | 2–5 m | Current electrode separation |
| FDEM | 6–100 m | 1–3 m | Frequency and coil separation |
| TEM | 150–500 m | 5–15 m | Pulse timing and loop size |
| AEM | 50–200 m | 10–30 m | Altitude and frequency |
ERT generally provides finer near-surface resolution. EM methods reach deeper with less field effort. Skin depth limits all EM methods in highly conductive ground.
4.3 Speed and Cost Efficiency
An electrical resistivity survey requires careful electrode placement. Setup time increases with array length. Data acquisition is automated but sequential. A typical 2D profile takes four to eight hours.
An electromagnetic geophysical survey moves faster. Ground EM profiles kilometers of pipeline routes in hours. Airborne EM covers hundreds of square kilometers per day. Per-hectare costs often run lower than ERT for large areas.
However, ERT provides more detailed near-surface imaging. It justifies higher field costs for projects requiring fine resolution. Many teams use EM for reconnaissance. They follow with ERT for target delineation.
4.4 Environmental Interference Profiles
Both methods face noise challenges. ERT struggles near buried utilities, power lines, and metal fences. These conductors distort current flow. High-contact-resistance terrain also degrades data quality.
EM surveys react strongly to external electrical sources. Power lines, buried cables, and magnetic minerals create false readings. Cultural noise limits urban EM deployment more severely than ERT in some cases.
Modern instruments combat these issues. ERT systems use integrated digital filtering. They maintain stable operation with signal-to-noise ratios above 80 dB. EM systems employ bucking coils and notch filters. They suppress power-line harmonics effectively.
Ⅴ. Industrial Applications and Case Evidence
5.1 Groundwater and Environmental Projects
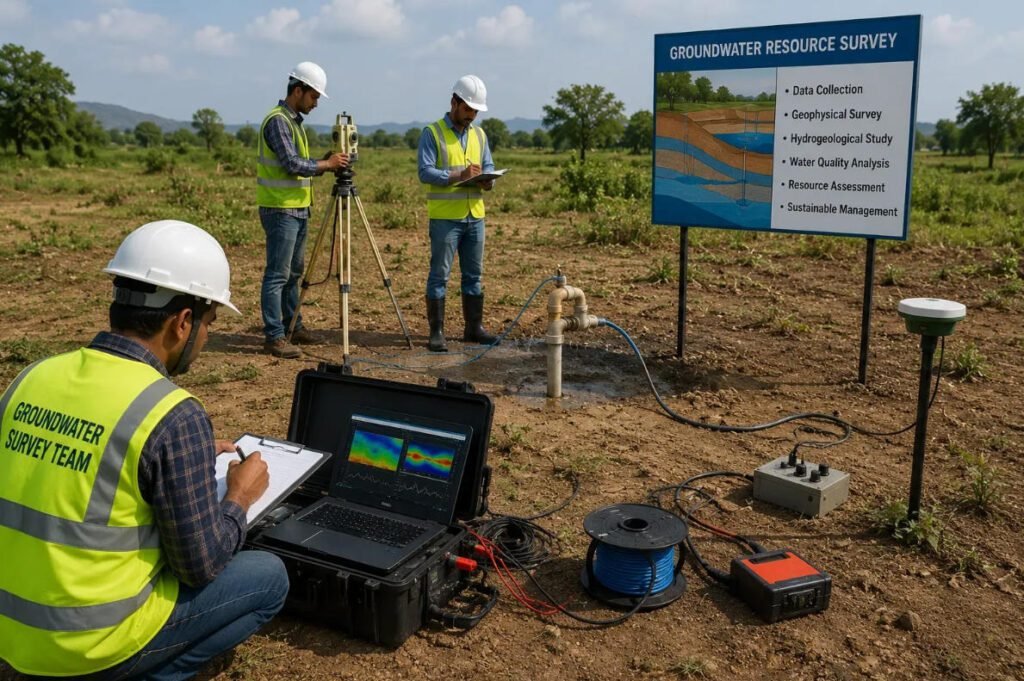
Electrical resistivity survey systems dominate groundwater exploration. They map aquifer geometry and water table depth. They delineate saltwater intrusion fronts. They track contaminant plumes at industrial sites.
In Northern Italy, researchers compared ERT and FDEM for coastal aquifer monitoring. Both methods detected saltwater wedges extending from the sea. FDEM provided faster regional coverage. ERT delivered finer vertical resolution at key transects. The combined approach yielded the most reliable salinity models.
Electromagnetic geophysical survey methods excel at rapid environmental screening. EM-31 instruments locate buried drums and tanks. EPA guidelines recommend EM for Superfund site reconnaissance. Non-contact operation protects crews at hazardous locations.
5.2 Mineral Exploration Workflows
Mining companies use both methods at different project stages. An electromagnetic geophysical survey covers large tenements rapidly. Airborne EM identifies conductive zones associated with sulfide mineralization. Ground EM follows up on anomalies with higher resolution.
An electrical resistivity survey provides detailed orebody delineation. It distinguishes silicified zones from host rock. Induced polarization add-ons identify chargeable sulfides. In Guangdong, China, a combined ERT-IP survey mapped Pb-Zn ore geometry with resistivity errors below 15 percent.
5.3 Civil Engineering and Hazard Assessment
ERT systems identify karst cavities beneath highways and railways. In Guilin, China, ERT with five-meter electrode spacing located cavity clusters totaling 22,370 cubic meters. The survey revealed “high-resistivity beads plus low-resistivity base” anomaly patterns. This data prevented foundation failures.
EM methods assess dam leakage and embankment integrity. Time-lapse EM tracks conductivity changes caused by seepage. Borehole EM extends monitoring deep into dam foundations.
Ⅵ. Equipment Selection Framework
6.1 Decision Matrix for Project Managers
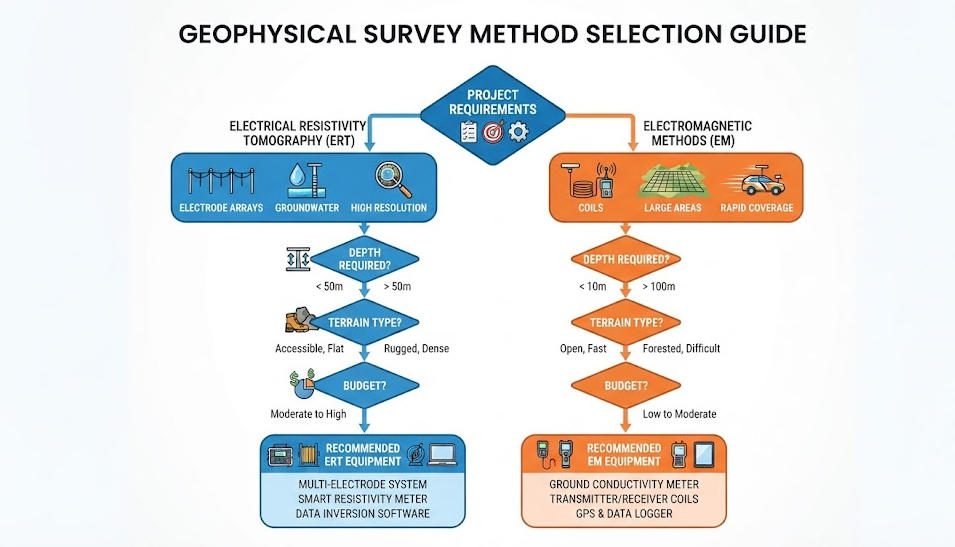
Use this matrix to guide method selection:
| Project Need | Recommended Method | Rationale |
|---|---|---|
| Shallow groundwater mapping | ERT | High resolution, proven aquifer contrast |
| Large-area mineral reconnaissance | AEM/EM | Speed, coverage, cost efficiency |
| Urban utility detection | ERT or FDEM | ERT avoids EM cultural noise; FDEM avoids pavement breaking |
| Contaminated site screening | EM | Non-contact safety, rapid coverage |
| Deep orebody delineation | TEM or ERT | TEM reaches depth; ERT resolves geometry |
| Dam leakage monitoring | ERT time-lapse | Direct saturation tracking, repeatability |
6.2 Hybrid Survey Strategies
No single method solves every problem. Leading geophysical teams combine techniques. They use EM for regional reconnaissance. They follow with ERT for detailed target imaging. They validate results with selective drilling.
Hybrid workflows reduce exploration risk. They also cut total project costs. A drilling program might cost fifty thousand dollars per hole. An EM survey might cost five dollars per hectare. The EM survey identifies the best drill locations. It eliminates unnecessary holes. This targeting alone can save projects hundreds of thousands of dollars.
6.3 Future Technology Trends
Three innovations reshape the field:
- AI-driven inversion: Deep learning algorithms accelerate 3D model generation. ConvResNet methods now produce resistivity volumes in under two hours.
- Real-time processing: Cloud-based platforms deliver inverted models in the field. Teams adjust survey plans on the same day.
- Drone-mounted EM: Unmanned aerial systems expand airborne access. They reduce mobilization costs for remote or dangerous terrain.
Ⅶ. Conclusion
The choice between electrical resistivity survey and electromagnetic geophysical survey methods depends on project goals, site conditions, and budget constraints. ERT delivers unmatched near-surface resolution. It requires ground contact and careful setup. EM offers speed and non-contact flexibility. It sacrifices some resolution for operational efficiency.
Smart teams do not treat these methods as competitors. They treat them as complementary tools in a modern geophysical toolkit. EM reconnaissance narrows search areas. ERT characterization resolves critical details. Together, they reduce exploration risk and optimize capital deployment.
For B2B buyers evaluating new equipment, the decision framework is clear. Define your target depth and required resolution first. Assess site access and cultural noise conditions. Then match the method to the mission. The right geophysical system transforms raw data into confident subsurface decisions.
Reference Sources
Related Technologies, Methods & Resources
FAQ
Q1: What is the main difference between an electrical resistivity survey and an electromagnetic geophysical survey?
A: An electrical resistivity survey injects direct current into the ground through metal electrodes. It measures voltage differences to map subsurface resistivity. An electromagnetic geophysical survey uses alternating magnetic fields to induce eddy currents in conductive materials. It requires no ground contact. ERT excels at high-resolution near-surface imaging. EM offers faster, non-contact coverage over large areas.
Q2: Which method is better for groundwater exploration: ERT or EM?
A: An electrical resistivity survey is generally preferred for groundwater mapping. It provides superior vertical resolution. It clearly distinguishes water-bearing zones from dry formations. However, an electromagnetic geophysical survey works well for rapid regional aquifer reconnaissance. Teams often use EM to identify broad targets. They then deploy ERT for detailed cross-sections.
Q3: How deep can electrical resistivity survey and electromagnetic geophysical survey systems detect?
A: Standard electrical resistivity survey configurations reach 10 to 300 meters. Depth depends on electrode spacing and array type. Schlumberger arrays penetrate deeper than Wenner arrays. Electromagnetic geophysical survey depth varies by technique. FDEM reaches 6 to 100 meters. TEM reaches 150 to 500 meters. Airborne EM typically resolves targets to 200 meters.
Q4: Can electromagnetic geophysical survey methods work in urban environments?
A: Yes, but with limitations. EM surveys react to power lines, buried cables, and metal infrastructure. These sources create cultural noise. Ground EM can still locate utilities and map contaminated soil. However, an electrical resistivity survey often performs better in dense urban settings. Modern ERT systems use digital filtering to maintain high signal quality near utilities.
Q5: Should I use ERT and EM together on the same project?
A: Yes. Combined surveys reduce exploration risk and cost. Use an electromagnetic geophysical survey for rapid regional reconnaissance. It identifies conductive anomalies across large areas. Then deploy an electrical resistivity survey for detailed target characterization. This hybrid approach optimizes drilling locations. It eliminates unnecessary boreholes. It saves projects hundreds of thousands of dollars.