Welcome to Geotech!
-1.png)


Electrical Resistivity & IP Survey: Complete B2B Guide 2026
TIPS: Electrical resistivity tomography and induced polarization survey methods have become essential tools for modern geophysical exploration. This guide explains how ERT and IP technologies detect groundwater, minerals, and contaminants. You will learn how to choose between 1D, 2D, and 3D systems. You will also discover how to select the right resistivity equipment for your next B2B project. Electrical resistivity tomography delivers high-resolution subsurface images. Induced polarization survey data adds critical chargeability information. Together, they form a complete exploration package.
Ⅰ. Why ERT and IP Matter for Modern Geophysics
1. The market demands more data
Clients now expect comprehensive subsurface models. Single-method surveys often fail to deliver enough detail. Electrical resistivity tomography provides 2D or 3D images of underground structures. Induced polarization adds chargeability data. Together, they reduce drilling costs and improve target accuracy.
Mining companies face rising exploration expenses. Drilling each hole costs thousands of dollars. Geophysical pre-screening identifies the best drill locations. This approach slashes wasted holes. It also shortens project timelines. Environmental consultants face similar pressures. Regulators demand detailed contamination maps. ERT and IP deliver these maps quickly. They also track changes over time.
2. B2B procurement trends favor integrated systems
Mining companies and environmental consultants want multi-function instruments. A single resistivity meter that also collects IP and SP data saves field time. It also reduces logistics costs. Chinese manufacturers now offer competitive high-channel systems. These systems match Western performance at lower price points.
Integrated systems simplify training. Field crews learn one interface. They deploy one set of cables. They process data with one software package. This unity reduces human error. It also speeds up report delivery. Buyers should look for modular designs. Modules allow future upgrades without full replacement.
3. The shift from point data to continuous imaging
Traditional drilling provides point samples. Geologists interpolate between holes. This interpolation carries uncertainty. ERT fills the gaps. It creates continuous cross-sections. Every meter of the profile reveals subsurface conditions. Clients receive richer datasets. They make better decisions.
Ⅱ. How Electrical Resistivity Tomography Works
1. The basic physics
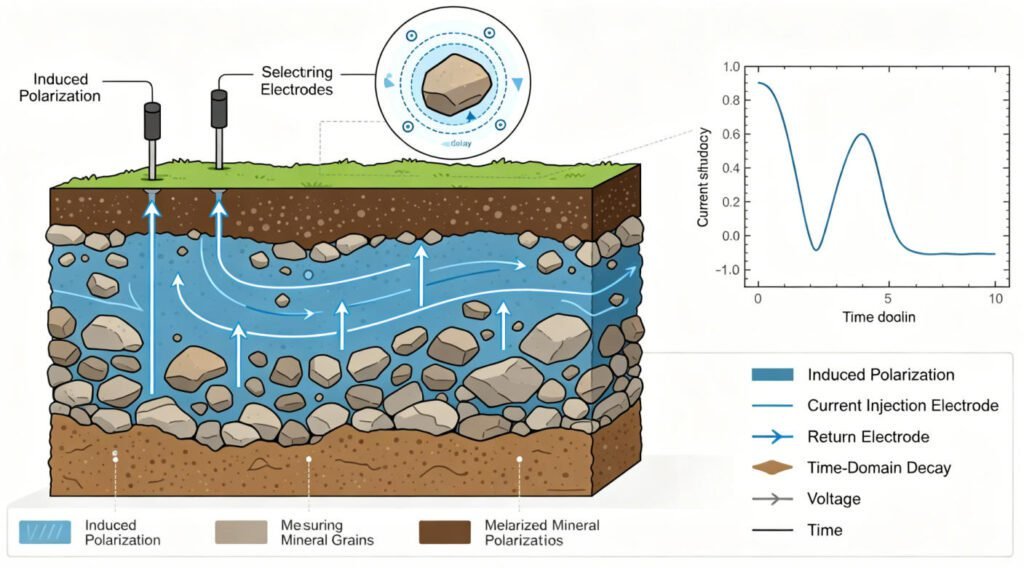
An ERT system injects direct current into the ground through two electrodes. Two other electrodes measure the resulting voltage. Ohm’s Law calculates resistance. The instrument then converts this value into apparent resistivity. This value reflects the bulk electrical property of the ground volume.
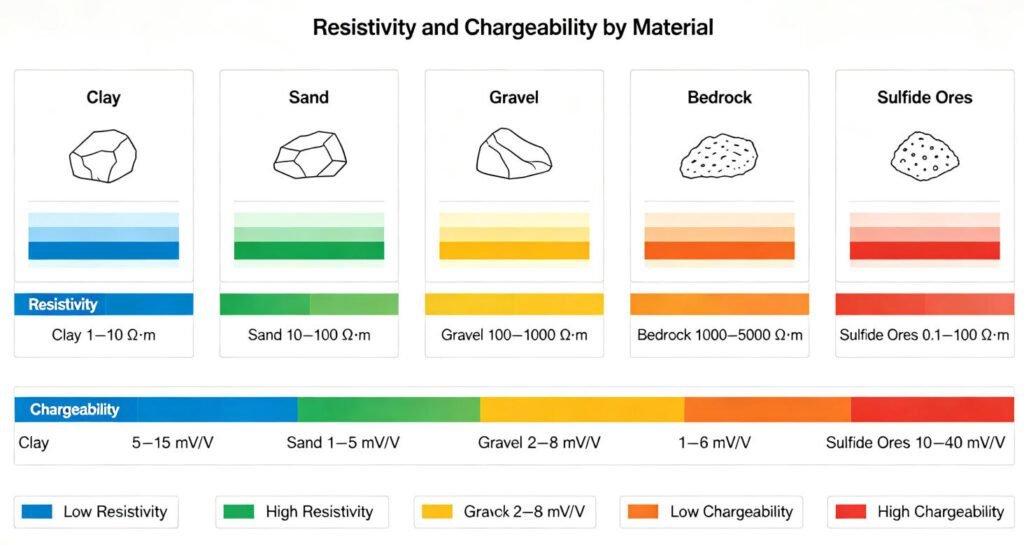
Water conducts electricity well. Rocks do not. The resistivity value depends on pore fluid chemistry. It also depends on saturation and clay content. Fresh granite shows high resistivity. Saturated clay shows low resistivity. These contrasts create interpretable images.
2. The galvanic connection
Resistivity methods need physical contact with the earth. Field crews push steel electrodes into soil or sediment. Plate electrodes work on hard surfaces. Water surveys use floating electrode arrays. Without good contact, data quality drops sharply.
Contact resistance must stay below 10 kΩ. Dry sand or frozen ground blocks current flow. Crews pour saltwater around electrodes. They also use conductive bentonite gel. In extreme cases, they drill shallow holes. They fill holes with conductive mud. These steps ensure stable current injection.
3. From resistance to resistivity
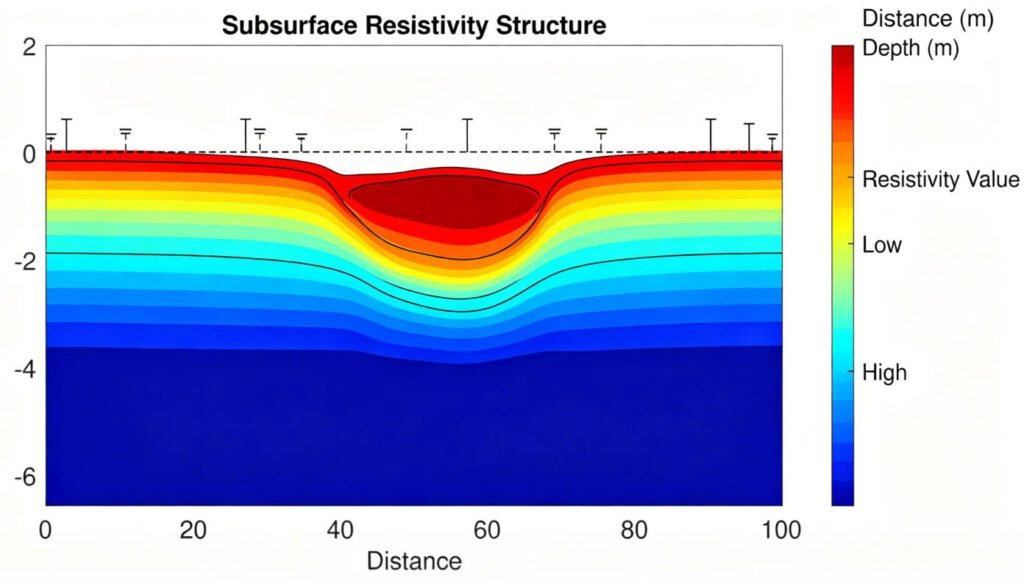
Apparent resistivity alone does not reveal geology. Inversion software processes the raw data. It builds a model that matches field measurements. The output shows true resistivity values in a cross-section or volume. Geophysicists then interpret lithology from these values.
Inversion is iterative. The software starts with a simple model. It calculates synthetic data. It compares synthetic data to field data. It adjusts the model. It repeats this process hundreds of times. The final model minimizes the error. Modern algorithms run in minutes. Older methods needed hours.
Ⅲ. Adding Induced Polarization for Clearer Images
1. What chargeability reveals
IP measures how ground voltage decays after current shut-off. This decay rate is called chargeability. Clay minerals and metallic sulfides show high chargeability. Clean sands and gravels show low values. IP data helps distinguish materials that share similar resistivity.
The physics involves complex impedance. Metallic minerals store electrical charge at grain boundaries. Clay particles create ionic double layers. Both effects delay voltage decay. The instrument records this delay in milliseconds. It converts delay into chargeability values. Units are typically mV/V or ms.
2. When IP reduces ambiguity
Resistivity ranges overlap between different rock types. For example, wet clay and saline water both show low resistivity. IP resolves this ambiguity. Clay gives high chargeability. Saline water gives low chargeability. The interpreter can now separate the two materials confidently.
Another example involves graphite and sulfide ores. Both show low resistivity. Graphite gives very high chargeability. Sulfides give moderate values. IP surveys distinguish these targets. This distinction prevents costly misidentification. Drillers avoid barren graphite zones. They focus on true ore bodies.
3. IP and resistivity: a synergistic pair
Modern instruments collect both datasets in one measurement cycle. The transmitter injects current. The receiver records voltage decay. Software outputs resistivity and chargeability sections side by side. This dual-parameter approach strengthens geological interpretation.
Field efficiency improves dramatically. Crews lay electrodes once. They collect two data types simultaneously. Field time drops by nearly half. Processing also integrates smoothly. Both datasets share the same geometry. Inversion software handles them together. The result is a unified geological model.
Ⅳ. Choosing Your Survey Dimension: 1D, 2D, or 3D
1. VES sounding for depth-focused projects
Vertical Electrical Sounding uses a fixed center point. Crews expand electrode spacing symmetrically. Larger spacing probes deeper layers. VES gives a 1D resistivity-depth curve. It works well for simple, layered geology. It also requires minimal equipment. However, it cannot detect lateral changes.
VES remains popular in groundwater exploration. Hydrologists need aquifer depth and thickness. They often assume horizontal layering. VES delivers this information cheaply. A four-electrode array and single-channel meter suffice. Small drilling companies own these systems. They use VES before placing water wells.
2. 2D ERT profiling for linear infrastructure
Electrical Resistivity Tomography places electrodes along a line. The instrument auto-selects electrode pairs. It collects thousands of data points rapidly. The result is a 2D cross-section showing depth and lateral variation. Engineers use 2D ERT for road surveys, dam inspections, and pipeline routes.
Standard arrays include Wenner, Schlumberger, and dipole-dipole. Wenner gives good vertical resolution. Dipole-dipole excels at horizontal resolution. Schlumberger balances both. Modern instruments support all arrays. They switch arrays automatically. This flexibility adapts to varying targets.
3. 3D ERT volumes for complex sites
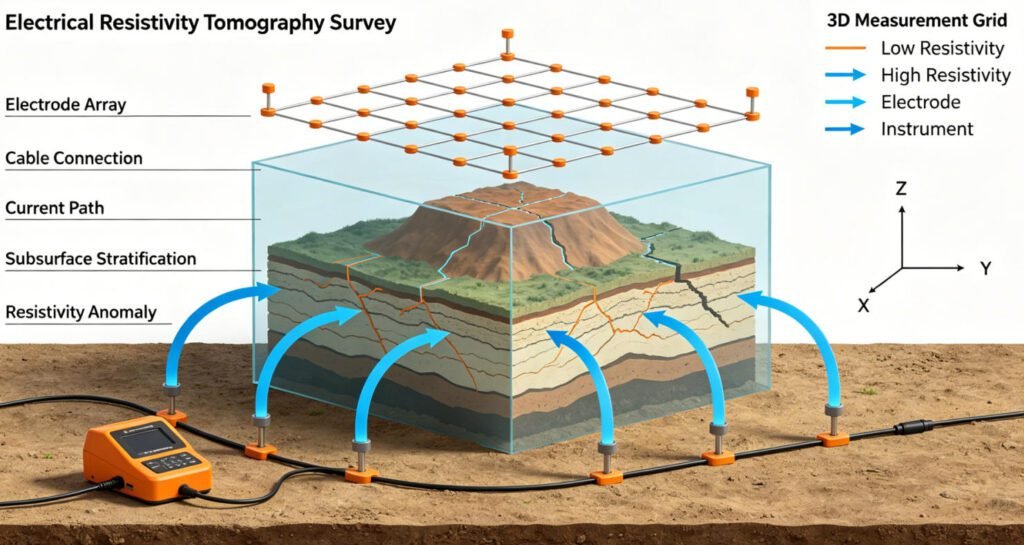
Three-dimensional surveys use parallel 2D lines or grid electrode layouts. Software inverts all data into a resistivity cube. 3D ERT reveals complex structures like karst cavities or ore bodies. It demands more electrodes and longer field time. The investment pays off when target geometry is complicated.
True 3D arrays place electrodes in a grid. The instrument measures all possible combinations. Data density is very high. Inversion produces detailed volumes. However, cable management becomes challenging. Some systems use wireless nodes. Nodes communicate with a central controller. This innovation simplifies logistics.
Ⅴ. Field Deployment Best Practices
1. Electrode selection and spacing
Steel electrodes suit most soils. Use non-polarizing Cu-CuSO4 electrodes for IP surveys. Spacing determines resolution and depth. A common rule states that depth equals spread length divided by five. For 100 m depth, you need 500 m cable spread. Lateral resolution is roughly half the electrode spacing.
Electrode spacing also affects target detection. Small targets need dense spacing. Large structures tolerate wider spacing. Budget constraints often limit electrode count. Buyers should select systems with expandable channels. Start with 48 channels. Add modules for larger projects.
2. Cable management
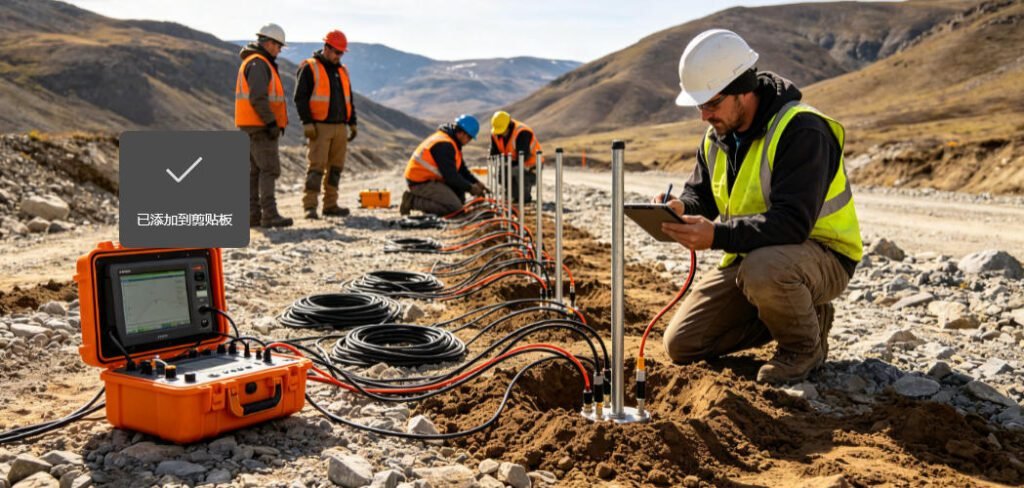
Multi-channel systems use 24 to 120 electrodes. Cable weight adds up quickly. Use vehicle-mounted cable reels for large spreads. Label every electrode position clearly. Check continuity before acquisition begins. Broken cables cause data gaps and inversion artifacts.
Color-coded cables reduce setup errors. Red cables mark current lines. Blue cables mark potential lines. Numbered tags identify each electrode. GPS coordinates record electrode positions. Accurate positions improve inversion accuracy. Some software accepts GPS input directly.
3. Quality control checks
Monitor contact resistance at each electrode. Values above 10 kΩ indicate poor contact. Wet the ground or use conductive gel. Repeat a few measurements to check repeatability. Remove noisy data points before inversion. Good field QC saves hours of office processing.
Stacking improves signal quality. The instrument repeats each measurement multiple times. It averages the results. Random noise cancels out. Stacking factors of 4 to 16 are common. Noisy environments need higher stacking. This setting increases acquisition time. Balance time against data quality.
Ⅵ. Data Processing and Inversion Workflow
1. From apparent to true resistivity
Raw data shows apparent resistivity. This is a weighted average of all materials below the electrodes. Inversion algorithms adjust a starting model. They minimize the difference between observed and calculated values. The final model displays true resistivity distribution.
Starting models matter. A homogeneous half-space model works for simple geology. Layered starting models speed convergence. Complex sites need more sophisticated initial guesses. Some software builds starting models from borehole data. This constraint improves inversion reliability.
2. Software options for B2B teams
Commercial packages like RES2DINV and RES3DINV handle most projects. Some manufacturers include custom software. Open-source alternatives exist for academic users. Cloud-based platforms now offer real-time inversion. Choose software that supports your electrode array and export formats.
Export compatibility is critical. Clients may require GIS formats. AutoCAD integration helps engineering teams. VTK formats feed 3D visualization tools. Check software output options before purchase. Training and support also matter. Choose vendors with active user forums.
3. Validation with borehole data
Geophysical interpretation always carries ambiguity. Compare inversion results with local borehole logs. Calibrate resistivity ranges for your specific area. Update the geological model when new data arrives. This integrated approach builds client confidence.
Borehole logging provides ground truth. Resistivity logs from boreholes calibrate surface ERT. Gamma logs confirm clay layer identification. This multi-data fusion reduces uncertainty. It also justifies exploration budgets. Clients trust integrated reports more than standalone geophysics.
Ⅶ. Application Matrix for B2B Buyers
1. Groundwater and aquifer mapping
Freshwater aquifers show high resistivity. Contaminated or saline zones show low values. ERT maps aquifer thickness and boundary geometry. IP identifies clay layers that may block water flow. Combined surveys reduce drilling uncertainty.
In arid regions, ERT locates fracture zones. These zones host groundwater in hard rock. Resistivity contrasts between weathered and fresh rock are strong. 2D profiles trace fracture orientations. Drillers target high-resistivity zones. Success rates improve significantly.
2. Mineral and ore body detection
Sulfide minerals exhibit both low resistivity and high chargeability. IP is the primary tool for disseminated ore exploration. Resistivity maps the host rock structure. 3D ERT plus IP targets deep porphyry deposits. These methods cut exploration risk significantly.
Porphyry copper deposits show large IP anomalies. The anomalies extend hundreds of meters. IP detects the sulfide halo. Resistivity maps the alteration zone. Together, they outline the entire system. Drillers place holes within the anomaly core. This targeting reduces wildcat drilling.
3. Environmental contamination tracking
Organic pollutants alter soil resistivity. Leachate from landfills creates conductive plumes. ERT monitors plume migration over time. Repeat surveys show seasonal changes. Long-term monitoring arrays provide early warning.
Saltwater intrusion also creates clear signatures. Freshwater shows high resistivity. Seawater shows very low values. ERT maps the freshwater-saltwater interface. This mapping protects coastal aquifers. It guides sustainable pumping strategies.
4. Engineering and geotechnical surveys
ERT maps bedrock depth for foundation design. It detects voids and fracture zones. Engineers combine ERT with seismic data for stiffness profiles. Resistivity cannot measure mechanical strength directly. It does reveal moisture and clay content that affect stability.
Karst terrain poses special risks. Hidden cavities threaten building safety. ERT detects air-filled voids. These voids show very high resistivity. 3D surveys map cavity networks. Engineers then design targeted grouting programs. This approach saves remediation costs.
Ⅷ. Equipment Selection Guide
1. Key specifications
Channel count determines survey speed. A 120-channel system covers large spreads faster than a 24-channel unit. Maximum current affects depth penetration. Look for 1 A or higher for deep targets. Input impedance should exceed 50 MΩ for accurate voltage measurement.
Resolution also matters. A 24-bit ADC captures small signals. This precision helps in noisy environments. Dynamic range should exceed 120 dB. Wide range handles both near-surface and deep signals. Check these specs in the datasheet.
2. Multi-channel vs. single-channel
Single-channel meters cost less. They suit VES and small profiling jobs. Multi-channel systems excel at 2D/3D ERT. They reduce field labor and human error. For B2B service companies, multi-channel instruments improve project throughput.
Rental options exist for occasional users. However, frequent users benefit from ownership. Maintenance contracts ensure uptime. Spare parts availability matters for remote projects. Chinese suppliers now offer global shipping. They also provide English-language support.
3. Portability and power
Lightweight receivers suit mountainous terrain. Vehicle-mounted transmitters handle high-power jobs. Battery life matters for remote sites. Some systems offer solar charging. IP surveys need stable current sources. Verify transmitter waveform fidelity before purchase.
Weight specifications vary. Handheld units weigh under 5 kg. Full ERT systems with cables exceed 50 kg. Consider helicopter transport for remote areas. Waterproof ratings protect against rain. IP67 cases withstand harsh conditions. These details affect field reliability.
Ⅸ. Limitations and Practical Solutions
1. Hard surface access
Bare rock, frozen ground, and concrete resist electrode insertion. Solutions include drilled electrode holes, plate electrodes, or capacitive coupling systems. Each alternative adds cost and setup time. Plan for these constraints in your project budget.
Plate electrodes use large metal sheets. Crews place sheets on the surface. They weigh them down with rocks. Current spreads through the contact area. This method works on pavement. It also works on exposed bedrock. Signal quality is lower than rod electrodes. But it enables surveys where rods fail.
2. Depth vs. resolution trade-offs
Deep surveys need wide electrode spacing. Wide spacing reduces lateral resolution. You cannot have both simultaneously. Define your primary target before designing the array. Shallow, high-resolution surveys use dense spacing. Deep reconnaissance surveys accept lower resolution.
The relationship is mathematical. Depth of investigation equals AB/2 for Schlumberger arrays. Lateral resolution equals electrode spacing divided by two. For 10 m spacing, you resolve 5 m features. For 50 m spacing, you resolve 25 m features. Plan accordingly.
3. Combining with other methods
ERT measures electrical properties. It does not measure mechanical strength. Pair ERT with seismic refraction for bedrock quality. Use GPR for very shallow detail. Electromagnetic methods cover large areas rapidly. Multi-method surveys reduce interpretation risk.
Seismic refraction measures P-wave velocity. Velocity correlates with rock stiffness. Combine ERT resistivity with seismic velocity. The combination distinguishes saturated clay from loose sand. Both show low resistivity. But clay has low velocity. Sand has higher velocity. This joint interpretation improves geotechnical models.
Ⅹ. Conclusion
Electrical resistivity tomography and induced polarization offer powerful, non-destructive subsurface imaging. B2B buyers should evaluate channel count, current output, and software compatibility. Match the survey dimension to your geological complexity. Always validate geophysical results with direct sampling. With proper equipment and workflow, ERT and IP deliver reliable data for groundwater, mineral, and environmental projects worldwide.
The technology continues to evolve. Wireless electrodes are emerging. Real-time cloud inversion is becoming standard. AI-assisted interpretation is on the horizon. Early adopters gain competitive advantage. They deliver faster results. They also reduce exploration risk for their clients.
Reference Sources
| Organization | Focus Area | URL |
|---|---|---|
| U.S. Geological Survey (USGS) | Geophysical methods & groundwater | https://www.usgs.gov/mission-areas/water-resources |
| Society of Exploration Geophysicists (SEG) | IP & resistivity technical standards | https://seg.org/ |
| European Association of Geoscientists & Engineers (EAGE) | Near-surface geophysics & ERT | https://www.eage.org/ |
| U.S. Environmental Protection Agency (EPA) | Electrical methods for contamination | https://www.epa.gov/ |
| China Geological Survey (CGS) | Electrical prospecting guidelines | http://www.cgs.gov.cn/ |
FAQ
Q1: What is the difference between ERT and IP?
A: ERT measures how strongly the ground resists electrical current. IP measures how quickly voltage decays after the current shuts off. ERT reveals water content and lithology. IP reveals clay and metallic mineral content. Together, they reduce interpretation ambiguity.
Q2: How deep can resistivity surveys reach?
A: Depth depends on electrode spacing and transmitted power. A common rule is depth equals total spread length divided by five. Typical systems reach 100–300 meters. High-power systems with wide spacing can reach 500 meters. Beyond 500 meters, other geophysical methods are recommended.
Q3: What is the cost of ERT equipment?
A: Single-channel resistivity meters start near $3,000. Multi-channel 2D/3D ERT systems range from $15,000 to $60,000 depending on channel count and accessories. Chinese manufacturers offer competitive pricing with full technical support. Rental options are available for short-term projects.
Q4: Can ERT detect groundwater?
A: Yes. Freshwater aquifers show high resistivity compared with surrounding clay or saline zones. ERT maps aquifer boundaries, thickness, and depth. It also tracks seasonal water table changes. For best results, combine ERT with IP to identify clay layers that may block water flow.
Q5: How do I choose between 2D and 3D ERT?
A: Choose 2D ERT for linear projects like roads, pipelines, and dam profiles. It is faster and requires fewer electrodes. Choose 3D ERT for complex sites like karst terrain, mine planning, or contaminated land. 3D surveys need more equipment and field time. They deliver volumetric models that reveal target geometry more clearly.