Welcome to Geotech!
ERT and TDIP/IP: A Complete Technical Guide
TIPS:Electrical Resistivity Tomography (ERT) and Time-Domain Induced Polarization (TDIP/IP) are two complementary geophysical methods that map subsurface electrical properties in 2D and 3D. ERT measures how rocks and soils resist electrical current flow. TDIP captures the delayed voltage response after current shut-off. Together, they distinguish between water content, clay minerals, metallic ores, and contamination plumes. Modern systems like Geotech’s GIM Series acquire both datasets simultaneously. This dual-mode capability transforms site characterization for groundwater, mining, and environmental projects.
Ⅰ. What Is Electrical Resistivity Tomography (ERT)?
1. Definition and Core Principle
Electrical Resistivity Tomography (ERT) is a geophysical imaging method. It creates 2D or 3D models of subsurface resistivity distribution. The technique uses multiple electrodes arranged along a survey line or grid.
ERT injects direct current into the ground. It measures voltage differences between electrode pairs. By combining many measurements with different electrode combinations, it builds a tomographic image. This image reveals geological structures, water tables, and anomalous zones.
ERT is also called Electrical Resistivity Imaging (ERI). It extends the traditional 1D resistivity sounding method. The key advantage is lateral resolution. ERT captures horizontal variations that VES cannot detect.
2. How ERT Differs from VES
Many professionals confuse ERT with Vertical Electrical Sounding (VES). The difference is fundamental. <
| Feature | ERT (Electrical Resistivity Tomography) | VES (Vertical Electrical Sounding) |
|---|---|---|
| Dimension | 2D cross-section or 3D volume | 1D vertical profile |
| Electrode Count | 24–120+ electrodes | 4 electrodes |
| Data Output | Continuous resistivity image | Layered resistivity-depth model |
| Best Use | Lateral variation mapping | Depth estimation at single points |
| Field Speed | 4–8 hours per profile | 30–90 minutes per sounding |
| Resolution | 0.1–0.5 m (high-density) | 1–2 m (layer thickness) |
ERT excels at mapping complex geology. VES is faster for depth reconnaissance. For comprehensive surveys, combine both methods. Use VES for quick depth estimates. Follow with ERT for detailed spatial imaging.
Ⅱ. What Is Time-Domain Induced Polarization (TDIP/IP)?
1. The IP Effect Explained
Induced Polarization (IP) is an electrical phenomenon. It occurs when subsurface materials store electrical charge. After current injection stops, the voltage does not drop to zero immediately. Instead, it decays over time.
This delayed response is the IP effect. It resembles the charging and discharging of a capacitor. The effect arises from electrochemical processes at mineral-fluid interfaces. Clay minerals and metallic particles generate strong IP signals.
Time-domain IP (TDIP) measures this decay curve. It quantifies chargeability in milliseconds (msec) or millivolts per volt (mV/V). The US EPA notes that IP depends on physical and electrochemical properties related to mineralogy, pore fluid chemistry, and fluid-grain boundary interactions.
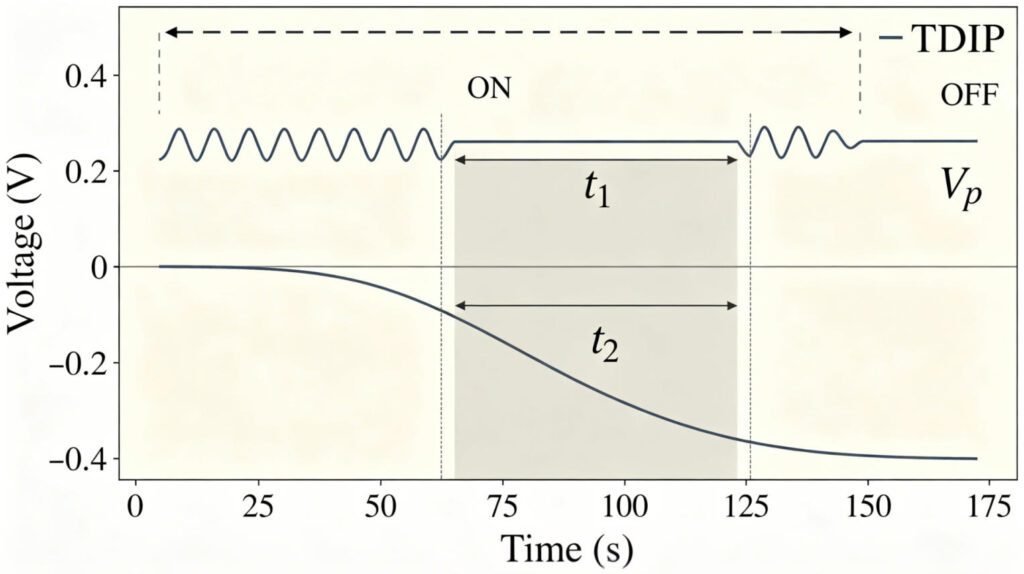
2. TDIP Measurement Process
The TDIP field procedure follows these steps:
- Inject direct current for a set duration (typically 1–4 seconds)
- Measure the primary voltage (Vp) during current ON-time
- Shut off the current
- Record the secondary voltage decay curve during OFF-time
- Integrate the decay curve over a time window (t1 to t2)
- Calculate apparent chargeability: ma = (1/Vp) × [1/(t2-t1)] × ∫V(t)dt
Chargeability values typically range from 1–100 mV/V. High values indicate clay-rich zones or disseminated sulfide minerals. Low values suggest clean sand or fractured rock.
3. Why TDIP Matters
ERT alone cannot distinguish all subsurface features. For example, conductive clay and conductive leachate may show similar resistivity. TDIP resolves this ambiguity.
Clay minerals generate high chargeability due to their large surface area. Metallic ores produce even stronger IP responses. Organic contaminants show intermediate values. This diagnostic power makes TDIP essential for:
- Mineral exploration (sulfide discrimination)
- Landfill characterization (waste body delineation)
- Environmental monitoring (contaminant type identification)
- Engineering geology (clay layer mapping)
Recent studies show that combined ERT and IP can differentiate multi-type landfill wastes. Chargeability thresholds of 10.2 mV/V effectively separate contaminated from background soil.
Ⅲ. Technical Methods and Implementation
1. Electrode Configuration for ERT
ERT uses multiple electrodes along a survey line. Common arrays include:
- Equal spacing between all electrodes
- Strong signal, good for shallow structures
- Less lateral resolution than dipole-dipole
Dipole-Dipole Array:
- High lateral sensitivity
- Best for vertical structures and cavities
- Weaker signal at depth
- Good vertical resolution
- Moderate signal strength
- Used in both ERT and VES
Modern multi-electrode systems like Geotech’s WGMD-4 support up to 18 electrode arrays. These include Wenner Alpha/Beta/Gamma, dipole-dipole, three-pole, and custom configurations. The system automatically switches between electrode combinations.
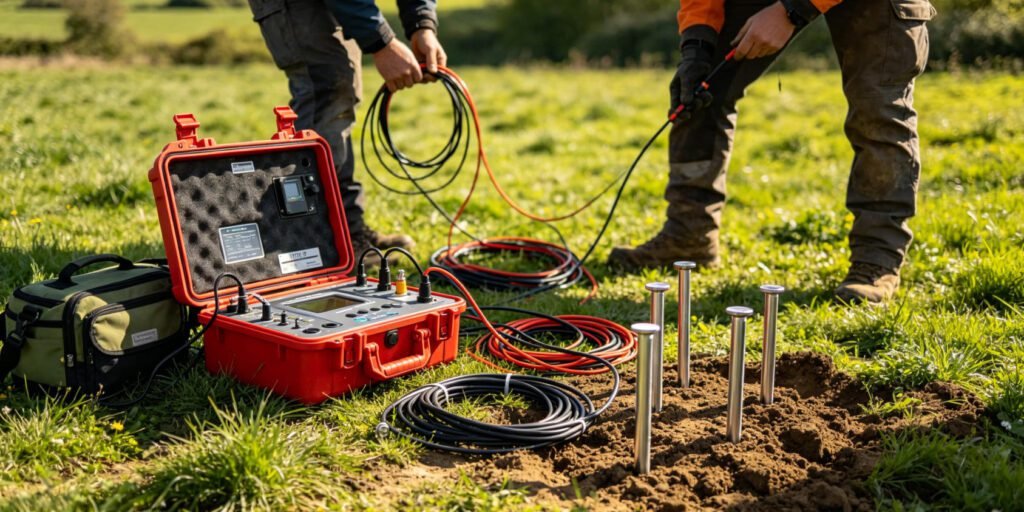
2. Data Acquisition Workflow
The ERT field procedure involves:
- Deploy electrodes at fixed spacing (typically 0.5–10 m)
- Connect cables to multi-channel resistivity meter
- Program the survey with array type and roll-along parameters
- System automatically selects current and potential electrode pairs
- Measure thousands of data points in a single deployment
- Store raw data with GPS coordinates and metadata
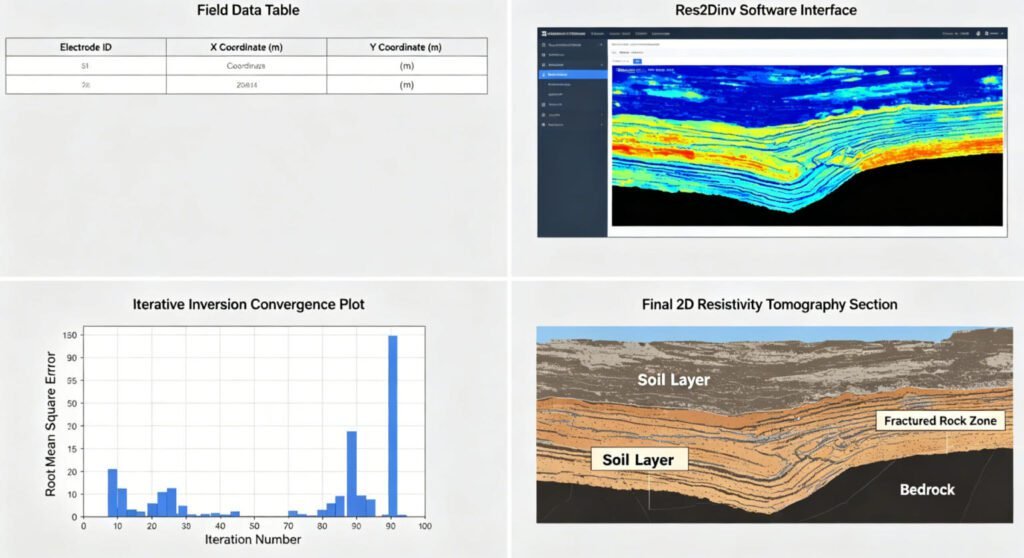
A typical 2D ERT survey with 60 electrodes and 5 m spacing covers 295 m line length. It collects 500–1,000 data points. Acquisition time is 15–30 minutes per roll-along section.
3. Data Processing and Inversion
Raw ERT data requires inversion to create subsurface images. The process involves:
- Import field data into inversion software (Res2Dinv, EarthImager)
- Check data quality and remove bad points
- Build initial resistivity model
- Run iterative least-squares inversion
- Apply regularization to stabilize the solution
- Generate 2D pseudosection or 3D volume
Modern software uses robust (L1-norm) constraints. These better resolve sharp boundaries between materials with contrasting resistivities. Smooth (L2-norm) constraints work better for gradual geological transitions.
4. TDIP Integration with ERT
Combined ERT and TDIP surveys use the same electrode setup. The resistivity meter injects current and measures both:
- Instantaneous voltage for resistivity calculation
- Decay voltage for chargeability calculation
This dual-mode acquisition adds minimal field time. The IP measurement occurs during the current OFF-time. Modern systems like Geotech’s GIM Series achieve polarization accuracy of 0.1 mV/V. Chargeability range spans 0.1–500 msec.
Ⅳ. Key Benefits of ERT and TDIP
1. Non-invasive and High Resolution
ERT and TDIP require only surface electrodes. No drilling is needed. High-density systems achieve 0.1 m resolution. This surpasses traditional geophysical methods.
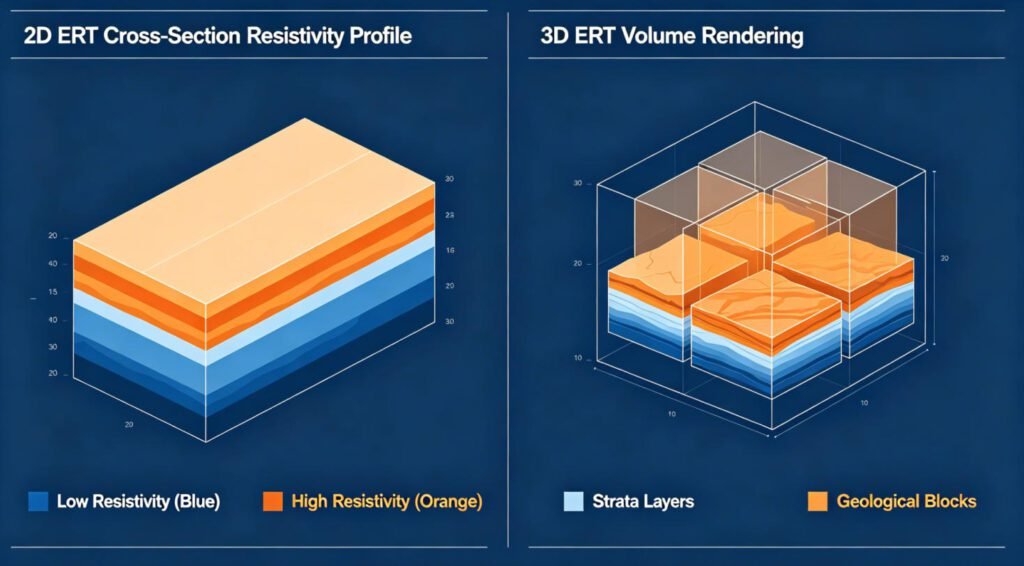
2. 2D/3D/4D Modeling Capability
ERT creates 2D cross-sections, 3D volumes, and 4D time-lapse sequences. This versatility supports:
- Static site characterization (2D/3D)
- Monitoring contaminant migration (4D)
- Tracking seasonal groundwater changes (4D)
- Dam seepage surveillance (4D)
Time-lapse ERT has proven effective for leachate injection monitoring and landfill degradation assessment.
3. Dual-Mode Diagnostic Power
Combined resistivity and IP data provide complementary information. Resistivity maps bulk electrical properties. IP identifies specific material types. Together, they reduce interpretation ambiguity.
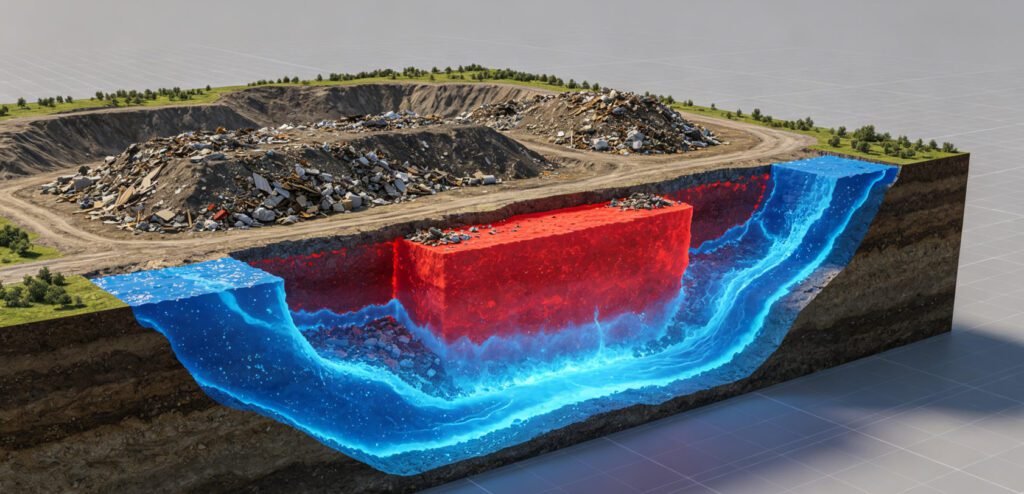
For example, in landfill surveys:
- Low resistivity + high chargeability = clay-rich waste
- Low resistivity + low chargeability = leachate plume
- High resistivity + high chargeability = metallic debris
This discrimination is impossible with resistivity alone.
4. Cost-effective Site Coverage
ERT covers large areas quickly. A single 2D profile replaces dozens of boreholes. 3D surveys map entire sites without excavation. Studies show ERT reduces investigation costs by 50–70% compared to full drilling programs.
5. Field Adaptability
Quality ERT equipment operates in diverse conditions. Geotech’s GIM Series works from -20°C to +60°C. The IP68 waterproof design handles harsh environments. This reliability matters for long-term monitoring installations.
Ⅴ. Advantages and Limitations
| Pros | Cons |
|---|---|
| High resolution: 0.1 m with dense arrays | Depth resolution decreases exponentially with depth |
| 2D/3D/4D output for complex geology | Large electrode arrays require significant setup time |
| Dual-mode ERT+IP reduces ambiguity | IP signals are weak (fractions of primary voltage) |
| Non-invasive: no site disturbance | Electrical noise in urban environments degrades data |
| Cost-effective: 50–70% less than drilling | Resolution poor near profile ends and at depth |
| Time-lapse monitoring capability | Requires advanced inversion expertise |
IP measurements face specific challenges. The signal level is low—often just a few percent of the primary voltage. This reduces signal-to-noise ratio. Advanced signal processing, including harmonic noise cancellation and background drift modeling, improves data quality.
Ⅵ. Applications of ERT and TDIP
1. Landfill Characterization
ERT and TDIP are the leading geophysical methods for landfill investigation. They map waste body extent, leachate plumes, and liner integrity.
The Belgium Meerhout case study deployed 110 electrodes with 2-second current pulses. Six-level dipole-dipole configuration achieved successful 3D contamination modeling. The survey identified low-resistivity zones correlating with leachate ionic strength.
In China, combined ERT and hydrochemical analysis evaluated a municipal solid waste landfill in Sichuan province. Resistivity profiles identified groundwater contamination zones extending 500 m downstream. The critical resistivity threshold for polluted groundwater was 13 Ω·m.
2. Groundwater Exploration
ERT delineates aquifer boundaries and maps freshwater-saltwater interfaces. TDIP adds porosity and permeability information. Combined surveys in coastal aquifers reveal salinity intrusion patterns with high accuracy.
A joint inversion framework integrating ERT, TDIP, and seismic refraction tomography quantitatively characterized coastal aquifers in Italy. The full petrophysical joint inversion accurately reconstructed water table levels, porosity distributions, and saline intrusion patterns.
3. Mineral Exploration
TDIP excels at detecting disseminated sulfide minerals. These ores generate strong chargeability responses. ERT maps alteration zones and structural controls.
Geotech’s GIM Series achieved 89% correlation between IP anomalies and drillhole intersections in a porphyry copper deposit. Detection depth reached 1,000 m. Exploration costs dropped 60% compared to grid drilling.
4. Engineering Geology
ERT assesses landslide risks, maps voids, and evaluates foundation conditions. TDIP identifies clay seams that act as failure planes. Cross-borehole ERT provides high-resolution imaging for tunnel design.
5. Environmental Monitoring
Time-lapse ERT tracks contaminant plume migration. It monitors remediation progress. It detects DNAPL (dense non-aqueous phase liquid) source zones. TDIP distinguishes between conductive clay and conductive contamination.
| Application Field | ERT Capability | TDIP Added Value |
|---|---|---|
| Landfill Mapping | Waste body extent, leachate plume | Waste type discrimination, liner integrity |
| Groundwater | Aquifer geometry, water table | Porosity, permeability, salinity |
| Mineral Exploration | Alteration zones, structures | Sulfide mineral identification |
| Engineering | Bedrock depth, voids, fractures | Clay seam detection, moisture |
| Environmental | Contaminant plume geometry | Contaminant type, remediation tracking |
Ⅶ. ERT and TDIP Equipment: Geotech Solutions
1. GIM Series Multi-Channel Resistivity & IP System
Geotech’s GIM Series is the next-generation platform for combined ERT and TDIP surveys. It integrates multi-channel acquisition with AI-driven processing.
Key Specifications:
- 24-bit high-precision A/D conversion
- 10-channel synchronous acquisition
- 1,000 m+ maximum penetration depth
- IP68 waterproof rating
- -20°C to +60°C operating range
- Polarization accuracy: 0.1 mV/V
- Chargeability range: 0.1–500 msec
- Dual-polarization cable support
- Time-domain and spectral IP options
Performance benchmarks show dramatic improvements over traditional single-channel systems:
| Parameter | Traditional Single-Channel | GIM Multi-Channel | Improvement |
|---|---|---|---|
| Daily Data Points | 500–1,000 | 50,000+ | 100× increase |
| Survey Depth | <500 m | 1,000 m+ | 400% deeper |
| Operational Efficiency | Baseline | 400% gain | 4× faster |
| Depth Resolution | 1–2 m | 0.1 m | 10–20× finer |
| Setup Time (100 electrodes) | 4 hours | 45 minutes | 81% reduction |
The GIM Series supports multiple arrays including Wenner, dipole-dipole, Schlumberger, and custom configurations. Rolling measurement mode covers long profiles efficiently. Learn more about the GIM-1 Single-Channel System and GIM-5 Multi-Channel System.
2. WGMD-4 High-Density Resistivity & IP System
The WGMD-4 is a versatile workhorse for 2D/3D ERT and IP surveys. It supports up to 120 electrodes with distributed or centralized configurations.
Technical Specifications:
- Maximum transmitting power: 6,600 W (VES mode), 2,400 W (imaging mode)
- Maximum voltage: ±1,100 V (2,200 Vp-p)
- Maximum current: ±6 A
- 24-bit A/D conversion, ±0.4% accuracy
- Input impedance: ≥50 MΩ
- 50 Hz suppression: ≥80 dB
- SP compensation: ±10 V
- Storage capacity: ≥1 GB (5,000,000+ data groups)
- Built-in lithium battery: 30+ hours continuous operation
- 18 electrode arrays available
Applications include groundwater exploration, mineral detection, dam seepage monitoring, and environmental assessment. The system supports cross-hole dipole measurements for advanced 3D imaging.
Explore the WGMD-4 Distributed System for large-scale surveys.
Ⅷ. Case Study: Gold Exploration with WGMD-4
1. Project Background
A gold exploration project required rapid delineation of potential ore zones. Traditional grid drilling was too expensive for the reconnaissance phase. Combined ERT and IP offered a cost-effective alternative.
2. Equipment Configuration
- Main device: WGMD-4 centralized high-density electrical method system
- Electrodes: 24 non-polarized electrodes
- Array: Dipole-dipole with multi-level configuration
- Software: Res2Dinv for 2D inversion
3. Implementation Process
- Deployed electrode array across the target area
- Acquired resistivity and IP data simultaneously
- Processed data using Res2Dinv inversion
- Identified chargeable anomalies correlating with sulfide alteration
- Validated with selective drilling
4. Key Results
- Identified continuous low-resistivity zone (<50 Ω·m) over 800 m
- Drilling verification showed <8% error in gold vein thickness
- Exploration cost reduced by 60% compared to full grid drilling
- Project duration shortened from 6 months to 6 weeks
5. Lessons Learned
- Combined resistivity and IP data reduce false positives
- Non-polarized electrodes improve IP data quality in resistive terrain
- Multi-level dipole-dipole array optimizes depth penetration
View the full case study: WGMD-4 Gold Exploration Application.
Related Resources
Explore more about Geotech’s electrical exploration solutions:
- What is Vertical Electrical Sounding (VES)?
- What is ERT Resistivity Imaging?
- ERT Equipment Complete Guide
- Electrical Resistivity Survey Methods
- ERT Geophysics Explained
- Soil Resistivity Testing Methods
Reference Source
| Authority | Source Type | URL |
|---|---|---|
| U.S. Environmental Protection Agency (EPA) | Government / Regulatory | https://www.epa.gov/environmental-geophysics/induced-polarization-ip-and-complex-resistivity |
| ScienceDirect / Elsevier | Academic Publisher | https://www.sciencedirect.com/topics/earth-and-planetary-sciences/electrical-resistivity-tomography |
| Guideline Geo (ABEM) | Industry Technology | https://guidelinegeo.com/methods/electrical-resistivity-and-induced-polarization/ |
| Frontiers in Water | Academic Journal | https://www.frontiersin.org/journals/water/articles/10.3389/frwa.2025.1636613/full |
| RAWFILL (Interreg NWE) | EU Research Project | https://vb.nweurope.eu/media/12925/6-rawfill-training-days_geophysics_ertip.pdf |
FAQ
What is the difference between ERT and electrical resistivity sounding?
ERT is a multi-dimensional method. It uses many electrodes to create 2D or 3D images of subsurface resistivity. Electrical resistivity sounding (VES) is a 1D method. It uses four electrodes at a single point to measure resistivity with depth. ERT provides lateral detail. VES provides rapid depth estimates. For comprehensive surveys, use both methods together.
How does induced polarization (IP) work in geophysics?
IP measures the delayed voltage response after current shut-off. When current flows through the ground, minerals and clays store electrical charge. After the current stops, this charge releases slowly. The decay curve is measured and quantified as chargeability. High chargeability indicates clay, sulfide minerals, or certain contaminants. IP is measured in time domain (TDIP) or frequency domain (SIP).
Can ERT and IP be measured simultaneously?
Yes. Modern resistivity meters like Geotech’s GIM Series and WGMD-4 acquire both datasets in a single deployment. The system measures resistivity during current ON-time and IP decay during OFF-time. This dual-mode capability adds minimal field time. It provides complementary information that reduces interpretation ambiguity.
What are the main applications of ERT and TDIP?
Primary applications include landfill characterization, groundwater exploration, mineral prospecting, engineering geology, and environmental monitoring. ERT maps subsurface structures and fluid distributions. TDIP identifies clay content, metallic minerals, and contaminant types. Combined use is standard for complex sites where resistivity alone cannot distinguish all features.
What depth can ERT and TDIP investigate?
Depth depends on electrode spacing and array type. A common rule is maximum depth equals one-third to one-fifth of the total array length. Typical 2D ERT surveys reach 50–300 m. High-power systems like Geotech’s GIM Series achieve 1,000 m+ in favorable conditions. IP signals weaken with depth, so TDIP is most effective in the upper 200 m. For deeper targets, use larger electrode spacings or cross-borehole configurations.
