Welcome to Geotech!
-1.png)


What is Induced Polarization (IP) Method? A Comprehensive Technical Guide
Overview:Induced Polarization reveals how subsurface materials temporarily store and release electrical charge after an applied field. The Induced Polarization response is commonly evaluated through chargeability and resistivity, making it valuable for mineral and hydrogeophysical investigations. This IP Method guide explains the physics, acquisition workflow, electrode arrays, inversion, interpretation, limitations, and equipment-selection factors. The IP Method becomes particularly useful when resistivity alone cannot adequately separate geological targets. Understanding Induced Polarization helps engineers design surveys that match geology, target depth, and signal-to-noise conditions.
Ⅰ. Technical Foundations of the IP Method
1. Core Definition and Physical Principles
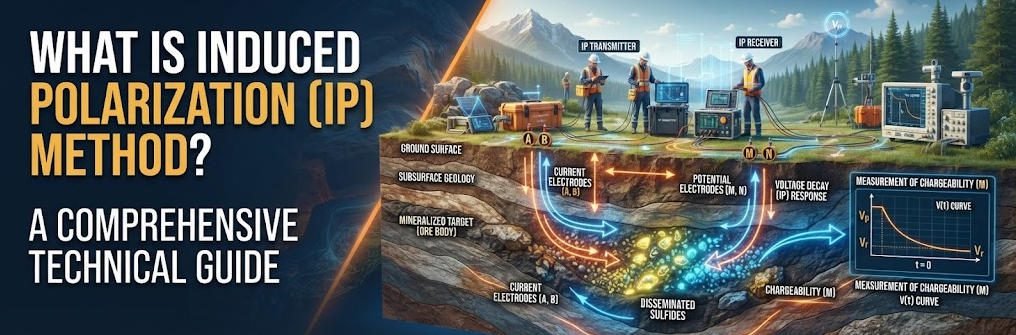
Induced Polarization (IP) is an active electrical geophysical method that measures subsurface chargeability by recording transient voltage decay after current injection.
The physical basis of IP lies in electrochemical polarization at mineral-fluid interfaces. When current flows across boundaries between electronic conductors and ionic electrolytes, an electric double layer forms at the interface. After injection current is terminated, this double layer discharges gradually, producing a measurable secondary voltage. The magnitude and decay pattern of this voltage carry information about the type, concentration and texture of polarizable materials.
The Cole-Cole model provides the standard mathematical description of IP relaxation behavior. It describes chargeability response as a function of time constant, chargeability coefficient and frequency exponent. This model supports both forward simulation and quantitative interpretation of field IP data. Response characteristics vary between mineral types, forming the basis for mineral discrimination.
2. Method Classification Matrix
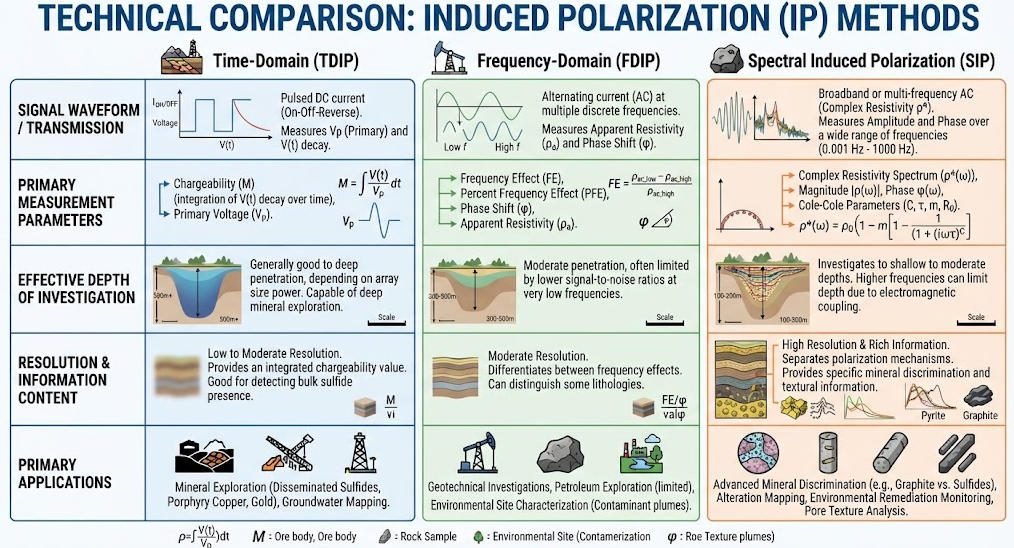
Induced polarization methods fall into three primary categories based on acquisition technique and information content. Each variant serves different depth ranges, resolution requirements and application objectives.
| IP Method Type | Dimensionality | Typical Depth Range | Lateral Resolution | Primary Applications |
|---|---|---|---|---|
| Time-Domain IP | 2D / 3D | 50 – 800 m | 2 – 10 m | Deep metal ore modeling, base metal exploration |
| Frequency-Domain IP | 2D | 20 – 300 m | 5 – 20 m | Groundwater contamination, shallow environmental monitoring |
| Spectral IP (SIP) | 3D | 100 – 500 m | 0.5 – 5 m | Mineral composition identification, detailed lithology |
Time-domain IP is the most widely used variant for mineral exploration. It samples the secondary potential decay curve over windows from 100ms to 8 seconds at sampling rates above 100Hz. Frequency-domain IP measures phase shift and amplitude response at discrete frequencies. Spectral IP uses broadband excitation across 0.01Hz to 10kHz for detailed mineralogical discrimination.
Ⅱ. Comparative Analysis and Technical Differentiation
1. IP vs. DC Resistivity Methods
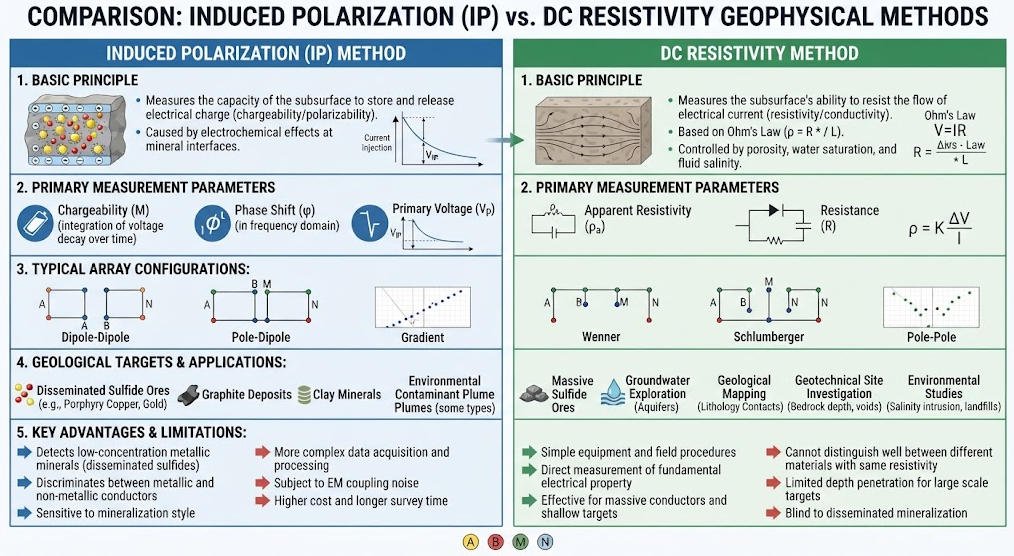
Both IP and DC resistivity methods inject current into the ground and measure voltage response. However, they measure fundamentally different electrical properties and provide distinct geological information.
| Parameter | IP Method | DC Resistivity Method |
|---|---|---|
| Measured Property | Chargeability + bulk resistivity | Bulk electrical resistivity only |
| Data Dimensionality | Dual-parameter output | Single-parameter output |
| Detection Sensitivity | Detects 0.1 mV/V polarization anomalies | Requires ~5% resistivity contrast for detection |
| Mineral Discrimination | Distinguishes sulfide vs. oxide mineral types | Limited to bulk conductivity differences |
| Core Technology | Full-waveform transient acquisition | Intelligent electrode switching profiling |
| Primary Strength | Mineral identification capability | High-resolution structural imaging |
Resistivity methods map spatial variations in bulk electrical conductivity. They excel at defining geological structure, aquifer geometry and lithological boundaries. IP methods add chargeability information that helps distinguish between different causes of conductivity anomalies. For example, IP can separate sulfide mineralization from graphite or brine water, which appear identical in resistivity data alone.
This complementary relationship makes combined IP-resistivity surveys standard practice in mineral exploration. Dual-parameter data reduces interpretation ambiguity and improves exploration success rates. Most modern multi-channel electrical systems support simultaneous acquisition of both parameters.
2. 2D vs 3D Data Inversion
IP data inversion converts field measurements into quantitative subsurface chargeability models. Inversion approaches vary in dimensionality, computational cost and output resolution.
2D inversion produces cross-sectional chargeability models along survey lines. Processing time ranges from 20 to 60 minutes per section for standard datasets. Typical resolution is approximately 5 meters vertical and 10 meters horizontal. It is suitable for rapid reconnaissance and linear survey corridors.
3D inversion generates volumetric chargeability models from grid or cross-line survey data. Standard processing requires 2 to 8 hours for typical survey volumes. AI-accelerated algorithms such as ConvIPNet can reduce computation time to 1.5 hours or less. Modern 3D inversion produces isotropic voxel resolutions down to 1 cubic meter for detailed target characterization.
Ⅲ. Industrial Applications and Field Case Studies
1. Mineral Resource Exploration
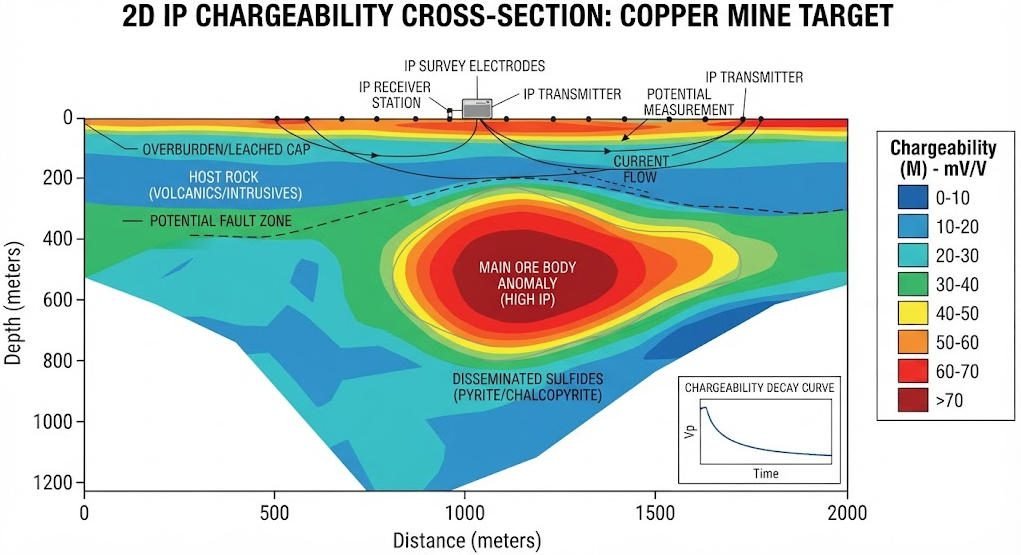
Induced polarization is a standard tool for base and precious metal exploration programs. It is particularly valuable for identifying disseminated sulfide mineralization that may be invisible to resistivity methods.
In the DRC copper-cobalt project, integrated IP and magnetic surveys produced a 3D ore body model. Final positioning error was less than 3% relative to subsequent drilling results. The survey used a multi-channel GeoRes-IP Pro system with full-waveform acquisition capability.
In Xinjiang copper mining operations, IP surveys successfully differentiated chalcopyrite from pyrite mineralization. Chargeability values exceeded 40 mV/V for chalcopyrite and remained below 25 mV/V for pyrite. This discrimination improved overall exploration targeting accuracy by approximately 35%. Results reduced unnecessary drilling and improved resource definition.
IP methods also detect graphite, magnetite and other electronically conductive minerals. They are commonly used in combination with magnetic and resistivity methods for integrated exploration programs. Combined datasets provide the highest confidence in mineral targeting.
2. Urban Geotechnical and Safety Applications
IP methods support urban engineering projects through detection of water-bearing features and subsurface hazards. Combined IP-ERT surveys provide complementary information about both lithology and fluid content.
In the Wuhan metro karst hazard program, joint IP-ERT inversion identified water-filled karst cavities. The survey mapped 22,370 cubic meters of water-bearing voids with chargeability values above 35 mV/V. Results supported proactive ground improvement and tunnel alignment planning. The dual-method approach improved detection reliability over single-method surveys.
IP also detects seepage pathways in dam and levee structures. Time-lapse IP monitoring can track changes in seepage patterns over time. This supports proactive maintenance and reduces infrastructure failure risk.
3. Environmental Engineering and Monitoring
Induced polarization supports environmental site assessment and long-term monitoring programs. It detects and maps organic contaminants that alter subsurface chargeability.
For VOC plume tracking applications, time-domain IP monitoring achieves detection sensitivity down to 0.5 ppm organic contamination. Chargeability anomalies correspond to contaminant concentrations and distribution patterns. Time-lapse surveys monitor plume migration and evaluate remediation effectiveness.
IP also helps monitor landfill leachate movement and groundwater quality degradation. It provides cost-effective large-area coverage compared to borehole monitoring networks. The method is particularly valuable for tracking contaminant migration in complex hydrogeological settings.
Ⅳ. Instrumentation and Technical Advantages
1. IP Equipment Product Lines
Modern IP survey systems range from basic portable units to high-density multi-channel platforms. They are optimized for different application scales and technical requirements.
| Product Line | Key Technical Features | Primary Application Scenarios |
|---|---|---|
| GeoRes-IP Pro | 256-channel synchronous acquisition, full-waveform recording | Deep metal ore modeling, large-scale exploration |
| HDR-IP360 | Dual chargeability-resistivity imaging, integrated processing | Groundwater contamination, geotechnical surveys |
| SIP-3D Master | 0.01Hz–10kHz broadband excitation, spectral analysis | Mineral composition identification, detailed lithology |
High-end systems support simultaneous resistivity and IP data acquisition. This dual-parameter capability improves survey efficiency and reduces field time. Modern instruments also include built-in quality control and real-time monitoring features.
2. Key Technological Innovations
Several technical advances have improved IP survey capability in recent years. Full-waveform acquisition captures the complete decay curve rather than discrete time gates. This provides more information for mineral discrimination and noise reduction.
Multi-channel synchronous acquisition improves data density and survey productivity. Systems with hundreds of channels enable efficient 3D survey designs. This reduces total field time and improves spatial resolution.
AI-accelerated inversion algorithms significantly reduce 3D processing time. Deep learning models also improve noise suppression and anomaly recognition. These advances make 3D IP surveys practical for routine exploration programs.
Ⅴ. Forward Modeling and Inversion Methodology
1. Forward Modeling
Forward modeling calculates theoretical IP response for a given subsurface chargeability model. It supports survey design optimization, anomaly interpretation and uncertainty assessment.
Numerical approaches include finite difference, finite element and integral equation methods. The Cole-Cole model is most commonly used to describe frequency-dependent IP response. Forward simulation helps determine whether a target is detectable with given survey parameters. It also supports optimal survey design for specific target types.
2. Inversion Approaches
Inversion converts measured IP data into subsurface chargeability models. It solves an ill-posed problem requiring regularization for stable solutions.
Standard approaches include:
- L2 norm regularization for smooth chargeability distributions
- L1 norm regularization for sharp boundary features
- Joint inversion with resistivity data for improved constraint
- AI-enhanced inversion for faster 3D processing
Joint inversion of IP and resistivity data produces more reliable models than either method alone. Each parameter provides independent constraints on the subsurface model. This reduces non-uniqueness and improves interpretation confidence.
Ⅵ. Advantages, Limitations and Selection Guidance
1. Core Advantages of the IP Method
Induced polarization offers several unique advantages over other electrical geophysical methods. First, it provides dual-parameter data that improves geological interpretation. Chargeability information distinguishes between different causes of conductivity anomalies.
Second, IP detects disseminated mineralization that resistivity methods may miss. It identifies small or dispersed metallic particles that produce weak bulk conductivity contrasts. This makes it particularly valuable for early-stage mineral exploration.
Third, IP supports mineral type discrimination based on characteristic decay signatures. Different sulfide minerals produce distinct chargeability responses. This reduces exploration risk and improves targeting accuracy.
2. Limitations and Mitigation Strategies
IP methods also have important limitations. First, they are generally slower and more expensive than standard resistivity surveys. Full-waveform acquisition and processing add complexity and cost.
Second, IP can be susceptible to cultural noise from power lines and buried metal. Electromagnetic interference can degrade data quality, particularly in urban environments. Proper survey design and noise suppression techniques help mitigate these effects.
Third, interpretation requires experienced geophysicists. Chargeability responses can have multiple geological explanations. Integration with other geological and geophysical data is essential for reliable interpretation.
3. Method Selection Framework
Select IP methods when mineral identification or disseminated sulfide detection is the primary objective. Use standard resistivity for general structural mapping and groundwater applications. Combine both methods for maximum confidence in complex geological environments.
表格
| Survey Objective | Preferred Method | Rationale |
|---|---|---|
| Bulk structural mapping | DC Resistivity / ERT | Higher resolution, lower cost |
| Sulfide mineral exploration | IP + Resistivity | Dual-parameter mineral discrimination |
| Shallow environmental screening | Frequency-domain IP | Rapid coverage, cost-effective |
| Detailed mineral identification | Spectral IP | Broadband mineralogical signature |
| Deep regional reconnaissance | Time-domain IP | Good depth penetration |
Related Articles
| Title | Core Content | URL |
|---|---|---|
| Electrical Resistivity Tomography: A Complete Technical Guide | ERT principles, apparent resistivity, electrode configurations, 2D/3D inversion and applications | https://geotechcn.net/service/electrical-resistivity-tomography-a-complete-technical-guide/ |
| A Comprehensive Guide to Electrical Resistivity Tomography | ERT survey design, applications, limitations and interpretation | https://geotechcn.net/service/geophysical-methods-ert-guide/ |
| ERT & TDIP Geophysical Survey Technologies | Direct comparison between ERT and Time-Domain IP | https://geotechcn.net/service/ert-tdip-geophysical-survey/ |
| Electrical Resistivity & IP Survey: Complete B2B Guide | Integrated ERT/IP survey planning and equipment selection | https://geotechcn.net/service/ert-ip-geophysical-survey-guide/ |
| GIM-1 Single-channel Intelligent Resistivity & IP Meter | Product-level resistivity/IP acquisition capabilities and configurations | https://geotechcn.net/products/electrical-instrument/gim-1-single-channel/ |
| Electrical Resistivity & IP Exploration Equipment | Geotech electrical instrument portfolio including IP systems | https://geotechcn.net/products/electrical-instrument/ |
| What Is ERT? Subsurface Imaging Guide | ERT fundamentals and subsurface imaging applications | https://geotechcn.net/service/what-is-electrical-resistivity-tomography/ |
| Comparative Study of Geophysical Exploration Methods | HDR, ERT and DC resistivity method selection | https://geotechcn.net/service/hdr-vs-ert-vs-dc-sounding-geophysical-method-guide/ |
Reference Sources
| Title | Core Content | URL |
|---|---|---|
| Induced Polarization (IP) and Complex Resistivity — U.S. EPA | IP fundamentals, time/frequency domains, polarization mechanisms, arrays and environmental applications | https://www.epa.gov/environmental-geophysics/induced-polarization-ip-and-complex-resistivity |
| Borehole Induced Polarization — U.S. EPA | IP chargeability, mineralogy, pore-fluid effects and borehole IP principles | https://www.epa.gov/environmental-geophysics/borehole-induced-polarization |
| Surface Geophysical Investigation Using Time-Domain IP — USGS | Field acquisition, chargeability measurements and inversion of TDIP data | https://pubs.usgs.gov/sir/2004/5208/ |
| Improved Hydrogeophysical Characterization Using Resistivity and IP — USGS | Joint resistivity and TDIP modeling/inversion for hydrogeophysics | https://www.usgs.gov/publications/improved-hydrogeophysical-characterization-and-monitoring-through-parallel-modeling |
| Induced Polarization as a Tool to Assess Mineral Deposits — Minerals | Scientific review of chargeability, mineralization and IP petrophysics | https://www.mdpi.com/2075-163X/12/5/571 |
FAQ
Q1: What is the induced polarization (IP) method?
IP is an active electrical geophysical method that measures subsurface chargeability by recording voltage decay after controlled current injection. It exploits electrochemical polarization at mineral-fluid interfaces, producing a chargeability response distinct from bulk resistivity. It is widely used for sulfide mineral exploration, groundwater contamination monitoring and geotechnical site investigation.
Q2: What is the difference between IP and DC resistivity methods?
Resistivity measures bulk electrical conductivity; IP measures chargeability at mineral-fluid interfaces. IP provides dual-parameter data that distinguishes sulfide minerals from other conductive features, while resistivity only detects conductivity contrasts. IP is preferred for mineral discrimination; resistivity serves general structural and groundwater mapping.
Q3: What are the main types of IP surveys?
The three primary types are time-domain IP, frequency-domain IP and spectral IP (SIP). Time-domain measures transient decay; frequency-domain uses multiple frequencies; SIP uses broadband excitation for mineralogical identification. Time-domain serves deep mineral exploration; frequency-domain serves shallow environmental surveys; SIP serves mineral composition analysis.
Q4: How deep can induced polarization surveys detect?
Standard time-domain IP reaches 50–800m depth; frequency-domain IP operates 20–300m; spectral IP covers 100–500m. Depth depends on array size, transmitter current, ground resistivity and target chargeability contrast. Deep IP systems are standard for base metal exploration; shallow systems serve environmental site assessment.
Q5: Can IP surveys distinguish between different mineral types?
Yes, IP can distinguish between sulfide mineral types based on characteristic chargeability signatures. Different minerals produce distinct decay responses; chalcopyrite typically shows higher chargeability than pyrite for example. This capability improves mineral exploration accuracy and reduces unnecessary drilling programs.