Welcome to Geotech!
-1.png)


Principle of High-Density Electrical Resistivity Survey and Case Analysis
TIPS:High-density electrical resistivity surveys reveal underground structures without drilling. This guide explains how high-density electrical resistivity works in karst detection, mining void surveys, and engineering geology. You will learn field deployment tactics, WGMD-4 system specs, and how Geotech interprets resistivity data from real projects in Guilin.
Ⅰ. What Is High-Density Electrical Resistivity Method
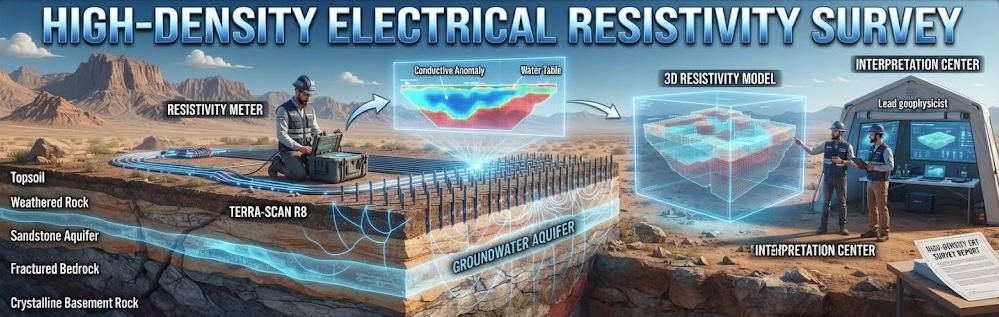
The high-density electrical resistivity method is an array-based geophysical technique. It evolved from traditional DC resistivity sounding. Early methods used four electrodes. Crews moved them manually for every reading. This was slow and labor-intensive.
Modern high-density systems change the game. They place dozens or hundreds of electrodes in a single line. A central controller switches electrode pairs automatically. One setup collects thousands of data points. No manual electrode movement is needed.
The method injects current into the ground. It creates an artificial electric field. Rock and soil resistivity controls how this field spreads. Measuring voltage at surface electrodes reveals subsurface resistivity distribution. Geologists then infer geological structures from these variations.
Water-saturated fractures show low resistivity. Intact limestone shows high resistivity. Clay layers show moderate resistivity. Each material creates a distinct electrical signature. High-density systems map these signatures in 2D cross-sections with sub-meter resolution.
Ⅱ. How the Technology Works in the Field
1.Array Configurations Explained
High-density systems support multiple electrode configurations. Each configuration reveals different subsurface features.
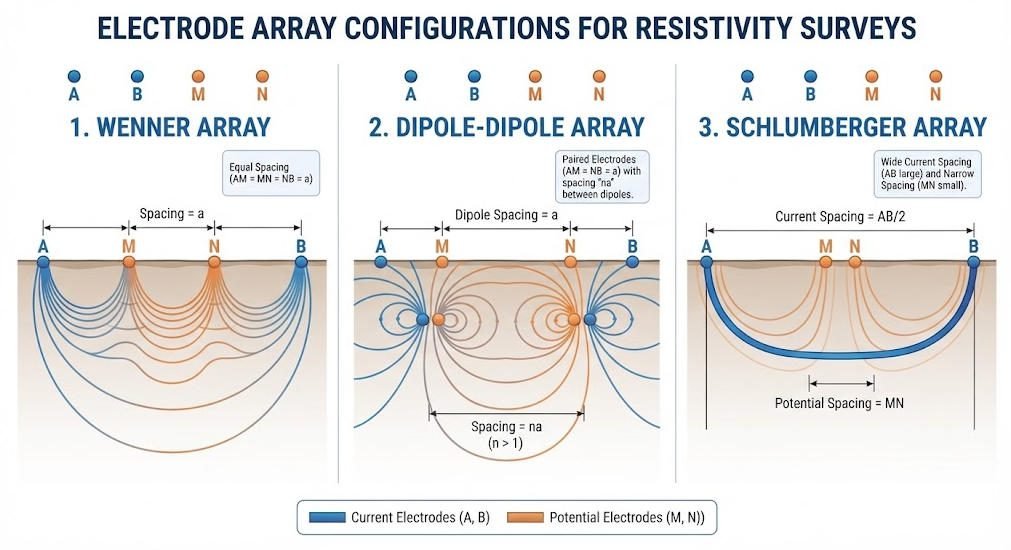
The Wenner array uses equal spacing between all four active electrodes. It provides excellent vertical resolution. It is the default choice for layered geology and karst detection. The Guilin case study used this configuration.
The dipole-dipole array uses paired current electrodes and paired potential electrodes. It excels at detecting lateral changes. It is ideal for mapping steeply dipping faults and vertical fractures. However, it produces lower signal strength at depth.
The Schlumberger array uses closely spaced potential electrodes between widely spaced current electrodes. It offers a balance of depth and lateral resolution. It is popular for deep engineering surveys.
The combined array runs Wenner and Schlumberger sequences in one deployment. It captures both vertical layering and lateral boundaries. Recent studies show combined arrays improve karst anomaly detection accuracy by 30% compared to single arrays.
Geotech’s WGMD-4 system supports 18 electrode array types. This includes Wenner alpha, beta, gamma, dipole-dipole, Schlumberger, and combined profiling modes.
2.Electrode Spacing and Depth Trade-Offs
Electrode spacing controls two things: exploration depth and horizontal resolution.
Smaller spacing gives higher resolution. It maps fine structures like thin clay layers or small cavities. However, it limits maximum depth.
Larger spacing probes deeper. It reveals bedrock topography and deep aquifers. But it smooths over small near-surface features.
The rule of thumb is simple. Maximum depth equals total array length divided by three to five. A 135 m array with 5 m spacing reaches roughly 25–30 m depth. This matches the Guilin project parameters perfectly.
For coal mine goaf detection, engineers often use 10 m spacing. The target voids are large and deep. For dam foundation termite nest surveys, 2 m spacing is better. The targets are small and shallow.
Ⅲ. Eleven Industry Applications
High-density resistivity serves diverse industries. Here are the primary use cases:
| # | Application | Target Feature | Resistivity Signature |
|---|---|---|---|
| 1 | Coal mine goaf detection | Air-filled voids | Very high resistivity |
| 2 | Dam foundation termite nests | Moisture-rich cavities | Low resistivity |
| 3 | Railway and highway karst surveys | Dissolution cavities | High/low mixed |
| 4 | Lithological boundary mapping | Rock type changes | Gradient transitions |
| 5 | Landfill leachate monitoring | Contaminated plumes | Very low resistivity |
| 6 | Archaeological tomb detection | Buried structures | Anomalous contrasts |
| 7 | Sewer pipeline location | Metallic/concrete pipes | High or low anomalies |
| 8 | Reservoir embankment leakage | Seepage pathways | Low-resistivity zones |
| 9 | Fractured bedrock detection | Water-filled fractures | Low resistivity |
| 10 | Soil salinity surveys | Salt accumulation | Very low resistivity |
| 11 | Buried tunnel and shelter detection | Air-filled spaces | High resistivity |
Each application demands specific array selection and electrode spacing. Karst surveys favor Wenner arrays with 5 m spacing. Goaf detection uses dipole-dipole with 10 m spacing. Leakage surveys need fine 2–3 m spacing near the water table.
Ⅳ. Field Methodology: A Practical Workflow
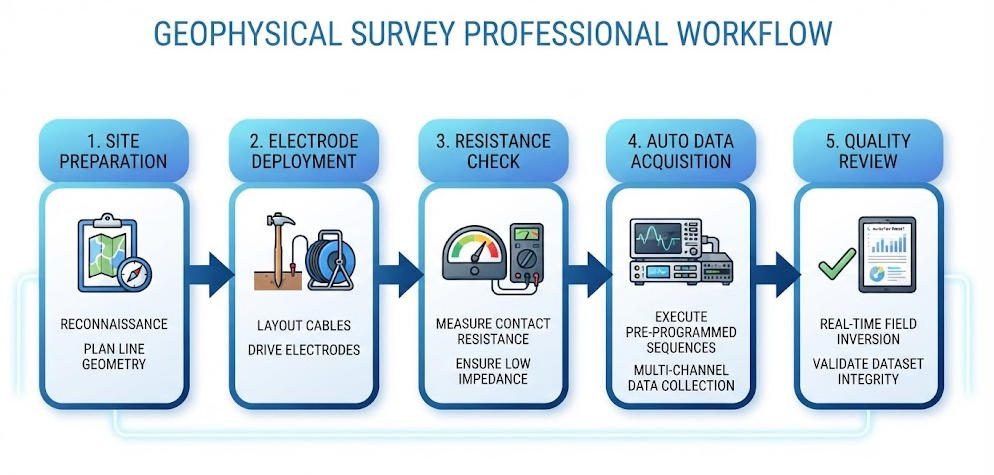
1.Site Preparation
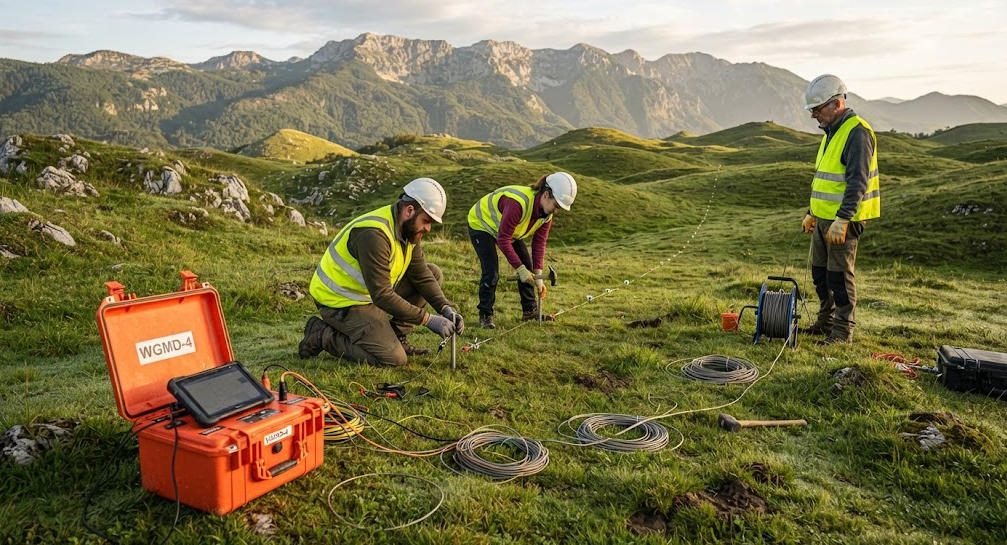
Good data starts with good ground contact. Electrode resistance must stay below 2,000 Ω. Dry soil, gravel, or exposed bedrock causes high contact resistance.
Field crews solve this in three ways. First, they drive electrodes deeper into moist subsoil. Second, they pour saltwater around each electrode. Third, they use bentonite mud to improve conductivity.
In the Guilin project, crews worked on reddish clay over limestone. Natural moisture kept contact resistance low. No saltwater treatment was needed.
Crews also clear the survey line. They remove metal fences, pipes, and cables. These create artificial anomalies. They mark the line with flags every 5 m. This ensures accurate electrode placement.
2.Data Acquisition
The WGMD-4 centralized system handles acquisition. Its specifications include:
- Transmitting power: up to 6,600 W (1,100 V × 6 A)
- Voltage channel: ±24 V with 24-bit A/D conversion
- Input impedance: ≥50 MΩ
- Self-potential compensation: ±10 V automatic
- 50 Hz suppression: ≥80 dB
- Storage: 1 GB internal, stores 5,000,000 data groups
The system runs on built-in lithium batteries. It operates for 30 hours continuously. All data has power-failure protection. If the unit shuts down unexpectedly, nothing is lost.
Crews connect the electrode cable to the controller. They input the array type and spacing. The system runs through the measurement sequence automatically. A full 135 m Wenner scan takes 2–3 hours.
3.Quality Control
Field crews monitor three quality indicators. First, they check contact resistance before starting. High resistance points get treated or relocated. Second, they review self-potential values. Stable SP indicates good ground conditions. Third, they inspect raw apparent resistivity curves. Smooth curves suggest reliable data. Erratic spikes indicate noise or poor contact.
The WGMD-4 includes real-time earth resistance inspection. Crews test any electrode at any time. This prevents wasted surveys from bad ground contact.
Ⅴ. Karst Cave Detection Case Study: Guilin, Guangxi
1.Project Overview
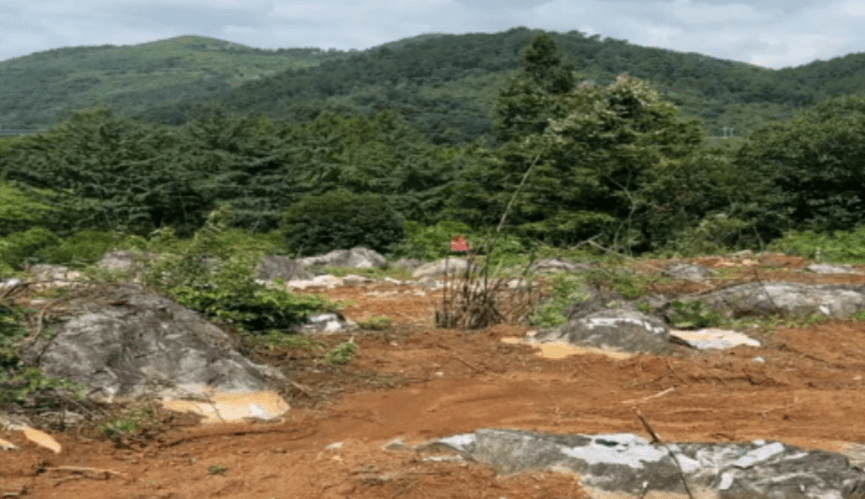
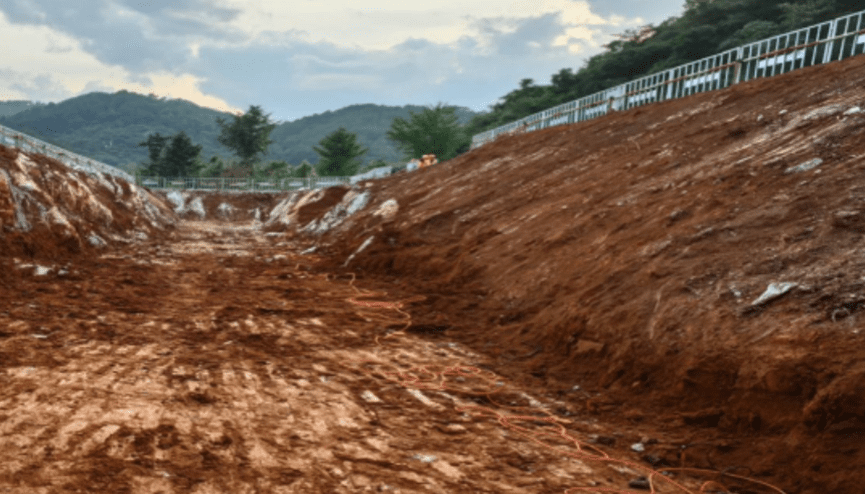
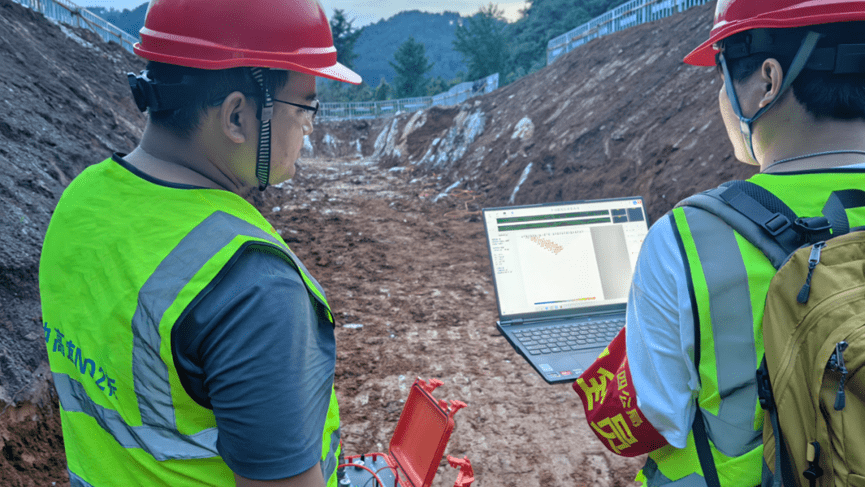
The survey site sits in Guilin, Guangxi. This region hosts world-famous tropical karst landforms. Peak-cluster depressions dominate the landscape. Underground caves are abundant. Most are soluble arch caves developed in limestone.
The project aimed to map hidden karst cavities before construction. Drilling alone would be expensive and slow. Geophysical screening was needed first.
Survey parameters:
- Array length: 135 m
- Electrode spacing: 5 m
- Configuration: Wenner
- Total electrodes: 28
- Instrument: WGMD-4 centralized system
2.Data Processing
Crews imported raw data into Swedish inversion software. The software uses smoothness-constrained least-squares algorithms. It converts apparent resistivity into true resistivity cross-sections.
The inversion process iterates until the model fits the data. The Guilin dataset converged at 5 iterations. RMS error was 4.2%. This indicates excellent data quality.
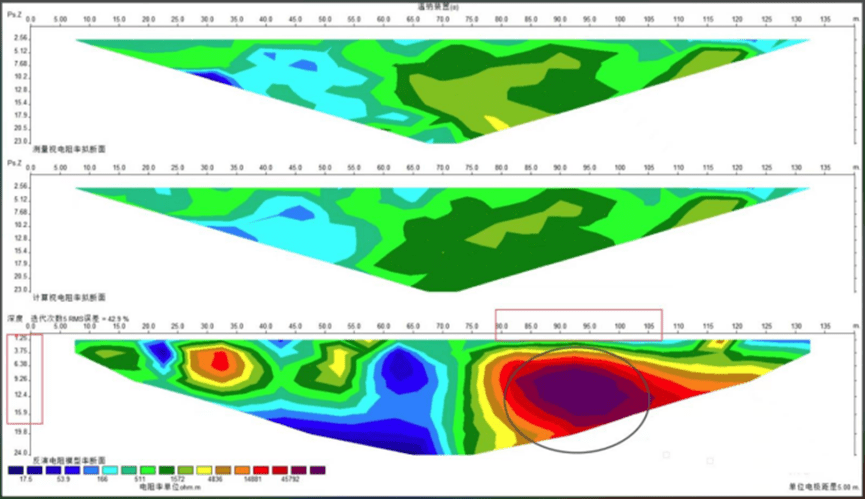
Figure 4: Data analysis diagram
3.Interpretation Rules for Karst
Geotech interpreters follow three principles when mapping karst from resistivity images.
Principle 1: Karst zones often show a “beads-on-a-string” pattern. The upper cavity is air-filled. It shows high resistivity. The lower cavity is filled with clay or water. It shows low resistivity. These high-low combinations appear as connected anomalies.
Principle 2: Karst develops in limestone. The background rock shows high resistivity. Any anomaly sitting in a high-resistivity background is suspicious.
Principle 3: Karst follows structural fracture zones. The strike and dip of bead anomalies match regional structures. Randomly oriented anomalies are less likely to be karst.
4.Results
The inversion revealed two major anomaly zones.
Zone A (left side, 20–40 m along profile): A strong high-resistivity core sat at 3–6 m depth. It was surrounded by moderate-resistivity halos. This matched an air-filled cavity with partial clay fill below.
Zone B (right side, 80–105 m along profile): A large low-resistivity body extended from 8 m to 18 m depth. Resistivity values dropped below 50 Ω·m. This indicated a fully water-filled cavity or heavily fractured zone.
Both zones were flagged for drilling verification. The project team avoided unexpected ground collapse during foundation work.
📌 Image Insert Position 4 — After Section ⅤFile Name:
guilin-karst-resistivity-inversion-section-anomaly-interpretation.webpALT Text:2D resistivity inversion cross-section from Guilin karst survey showing high and low resistivity anomalies interpreted as air-filled and water-filled cavitiesAI Prompt:Scientific 2D resistivity cross-section visualization, rainbow color scale from blue (low) to red (high), two distinct anomaly zones circled and labeled, depth axis on left, distance axis on bottom, geological interpretation annotations, clean white background, geophysical report style, high resolution
Ⅵ. Equipment Selection Guide
| Survey Objective | Array Type | Spacing | Recommended System |
|---|---|---|---|
| Shallow karst (<30 m) | Wenner | 3–5 m | WGMD-4 |
| Deep goaf (>50 m) | Dipole-dipole | 10 m | WGMD-10X |
| Dam leakage detection | Wenner + Schlumberger | 2–3 m | WGMD-4 |
| Archaeological survey | Wenner | 1–2 m | WGMD-4 |
| 3D volume mapping | Multiple parallel lines | 5 m | WGMD-9 |
For projects requiring induced polarization, the WGMD-4 supports IP measurements. It calculates metal factor, chargeability, and apparent polarizability. These parameters help distinguish clay-filled cavities from mineralized fractures.
Ⅶ. Limitations and Mitigation Strategies
High-density resistivity is powerful but not universal. Know its limits before planning your survey.
Depth limit: Most surveys reach 100 m maximum. Beyond this, electrode spacing becomes impractical. For deeper targets, consider transient electromagnetic methods.
Urban interference: Power lines, substations, and buried metal pipes create noise. The WGMD-4’s 80 dB 50 Hz suppression handles moderate interference. Severe environments may need nighttime surveys or remote locations.
Concrete and bedrock surfaces: Electrode penetration is difficult. Crews must use bentonite-filled holes or flat-plate electrodes. This increases setup time.
Non-uniqueness: Resistivity anomalies have multiple possible causes. A low-resistivity zone could be clay, water, or ore. Always integrate resistivity with geological knowledge. Drilling verification resolves ambiguity.
Related Articles
Explore more Geotech resources for your geophysical exploration projects:
- What Is Electrical Resistivity Tomography? Complete ERT Guide
- Comparative Study of Underground Electrical Exploration Methods
- ERT vs TEM: Which Geophysical Method Fits Your Project?
- Induced Polarization Method for Mineral Exploration
- Geophysical Exploration Classification & Applications
- WGMD-4 Distributed High-Density Electrical Method System
- WGMD-10X Multi-Channel High-Density System
- Geotech Electrical Instruments Product Center
Reference Sources
| Authority | Source URL |
|---|---|
| Society of Exploration Geophysicists (SEG) | https://seg.org/ |
| U.S. Geological Survey (USGS) | https://www.usgs.gov/ |
| European Association of Geoscientists & Engineers (EAGE) | https://www.eage.org/ |
| International Union of Geological Sciences (IUGS) | http://www.iugs.org/ |
| Geotech Instrument Co., Ltd. — Product Center | https://geotechcn.net/products/ |
FAQ
Q1: What is the difference between high-density resistivity and traditional DC sounding?
A: Traditional DC sounding uses four electrodes moved manually between readings. It produces 1D vertical profiles. High-density resistivity uses automated switching across many fixed electrodes. It creates 2D cross-sections with thousands of data points. High-density is faster, higher resolution, and requires less labor.
Q2: How deep can high-density electrical resistivity surveys reach?
A: Typical maximum depth is 100 m. Depth equals roughly one-third to one-fifth of the total electrode array length. A 135 m array reaches 25–30 m. For deeper targets, use larger spacing or switch to electromagnetic methods like TEM.
Q3: Why do karst caves show both high and low resistivity on the same section?
A: Air-filled cavities show high resistivity. Water-filled or clay-filled cavities show low resistivity. Many karst features have an air void above and a sediment fill below. This creates a “beads-on-a-string” pattern with high resistivity on top and low resistivity beneath.
Q4: Can one WGMD-4 system handle both resistivity and induced polarization surveys?
A: Yes. The WGMD-4 supports both general resistivity and IP functions. It offers 9 electrode arrays for resistivity/IP sounding and 18 arrays for 2D imaging. It measures apparent polarizability, metal factor, and chargeability automatically.
Q5: What causes poor data quality in high-density resistivity surveys?
A: Three factors cause most problems. High electrode contact resistance reduces signal strength. Nearby power lines introduce 50/60 Hz noise. Dry or rocky ground prevents current injection. Check contact resistance before acquisition. Use saltwater or bentonite around electrodes if needed. Survey at night to reduce power line interference.