Welcome to Geotech!


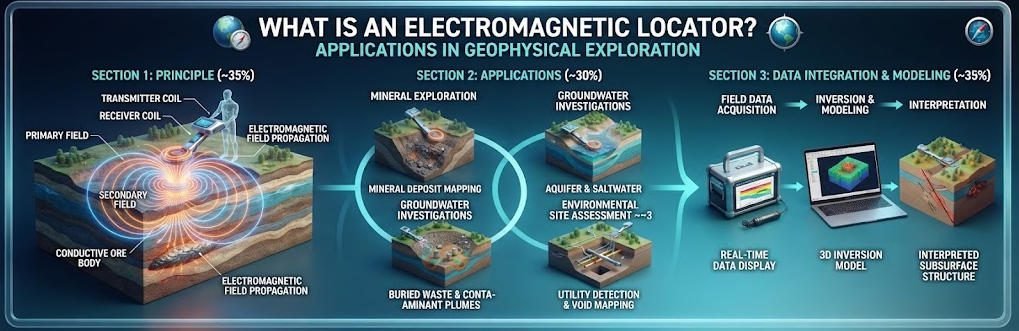
What is an Electromagnetic Locator? Applications in Geophysical Exploration
Overview:An electromagnetic locator detects subsurface targets through electrical property contrasts and electromagnetic field propagation. Electromagnetic locator technologies including ERT, DC sounding and IP deliver non-invasive subsurface mapping for mining, karst and utility engineering projects.
Ⅰ. Definition and Core Principles
1. Core Definition
An electromagnetic locator is a geophysical tool that identifies and maps subsurface targets by analyzing electrical property contrasts and electromagnetic field propagation in the ground. It covers direct-current resistivity methods and induced polarization techniques for near-surface investigation.
This category of equipment reconstructs subsurface electrical distributions from surface measurements, enabling detection, localization and characterization of buried geological bodies and man-made structures. Typical investigation depths range from a few meters to approximately 200 m for standard surface-deployed systems.
Electromagnetic locators are sometimes referred to as resistivity imaging systems or electrical geophysical instruments. They operate on passive and active electrical contrasts rather than electromagnetic induction in the strict sense.
2. Fundamental Physical Principles
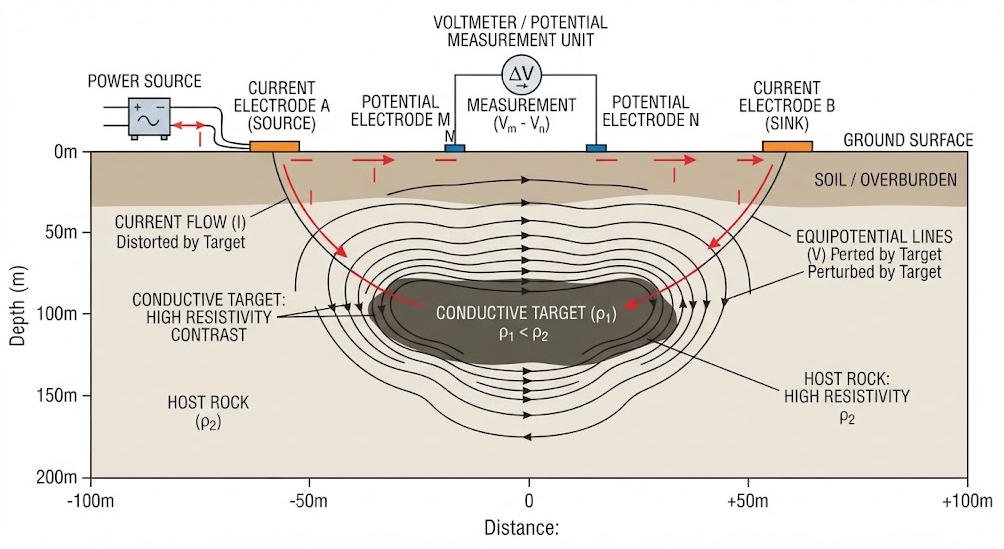
All electromagnetic locator methods rely on contrasts in electrical conductivity between target materials and surrounding host geology. Conductive materials include clay-rich soils, saline water, metallic ores and most buried utilities. Resistive materials include intact bedrock, fresh groundwater, voids and plastic structures.
When controlled electric current is injected into the ground through two electrodes, it establishes an electric field shaped by the subsurface conductivity distribution. Potential electrodes at the surface measure voltage drops that reflect this distribution. Apparent resistivity values are calculated from current, voltage and electrode geometry.
Induced polarization methods extend this principle by measuring transient voltage decay after current shut-off. This secondary polarization response reveals electrochemical properties of mineral grains and pore fluids, providing additional discrimination beyond bulk resistivity.
Ⅱ. Core Survey Methods
Electromagnetic locator systems deploy three primary survey methods, each optimized for different investigation objectives and geological settings.
1. Electrical Resistivity Tomography (ERT)
ERT uses dense linear or grid electrode arrays to generate 2D cross-sections or 3D volumetric resistivity models. It samples multiple depth levels simultaneously by varying electrode pair combinations.
Modern multi-channel systems acquire hundreds of data points per measurement cycle, producing high-resolution subsurface images. Typical electrode spacing ranges from 0.5 m for shallow detailed surveys to 20 m for deep regional investigations.
ERT is the primary method for detailed near-surface imaging. It excels at detecting karst conduits, fracture zones, contaminant plumes and near-surface geological structures.
2. DC Resistivity Sounding (VES)
DC resistivity sounding, also called vertical electrical sounding, profiles vertical resistivity variations by progressively expanding electrode spacing around a central point. The Schlumberger array is the most common configuration for this method.
As electrode separation increases, the depth of current penetration increases. The resulting sounding curve describes resistivity changes with depth at the survey point. Interpretation yields a layered earth model of resistivity vs. depth.
VES is ideal for deep stratigraphic analysis and regional reconnaissance. It is widely used for coal mine goaf assessment, aquifer mapping and deep bedrock detection where lateral variations are moderate.
3. Induced Polarization (IP)
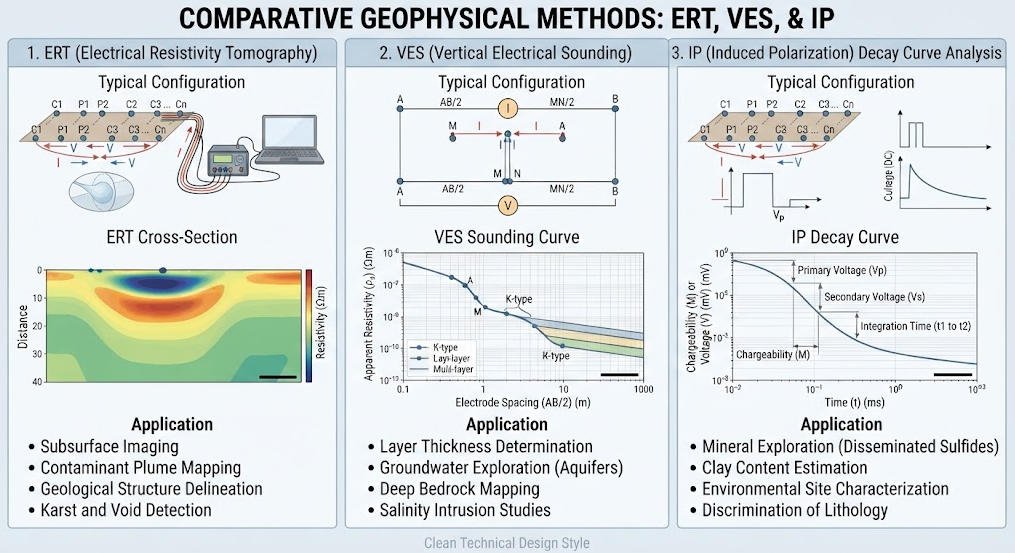
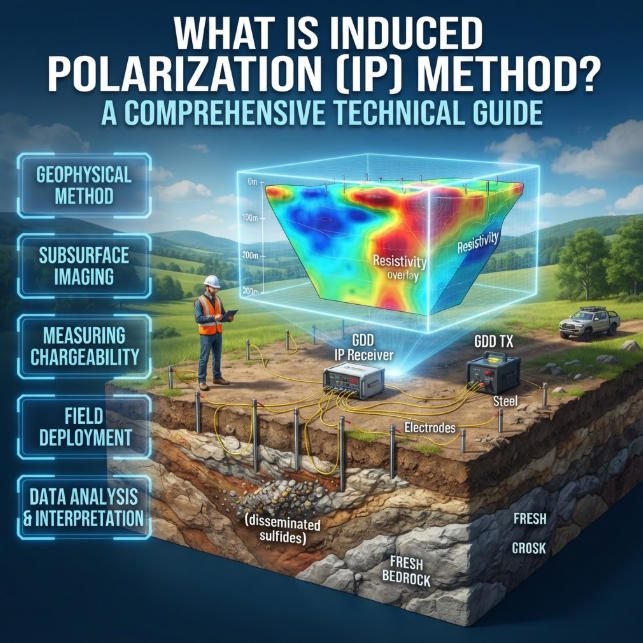
Induced polarization measures the transient decay of secondary electrical potential after injection current is switched off. The magnitude and rate of decay are quantified as chargeability, typically expressed in mV/V or milliseconds.
Chargeability is primarily controlled by clay minerals, metallic sulfides and electrochemical interactions at grain surfaces. It provides additional discrimination that resistivity alone cannot deliver.
IP is commonly deployed alongside resistivity surveys for mineral exploration, landfill characterization and clay distribution mapping. It helps distinguish conductive clay zones from conductive groundwater or metallic targets.
Method Comparison Summary
| Method | Output Format | Depth Range | Resolution | Primary Application |
|---|---|---|---|---|
| ERT | 2D/3D resistivity images | 2–200 m | High (sub-meter to meter scale) | Detailed site characterization, karst, pipelines |
| VES | 1D layered resistivity model | 10–500 m | Moderate (layered) | Stratigraphic analysis, regional reconnaissance |
| IP | Chargeability sections / soundings | 2–150 m | Moderate | Mineral exploration, clay mapping, landfill |
Ⅲ. 2D vs 3D Resistivity Imaging
Electromagnetic locator resistivity imaging is available in both 2D and 3D acquisition configurations, each with distinct strengths and limitations.
1. 2D Resistivity Imaging
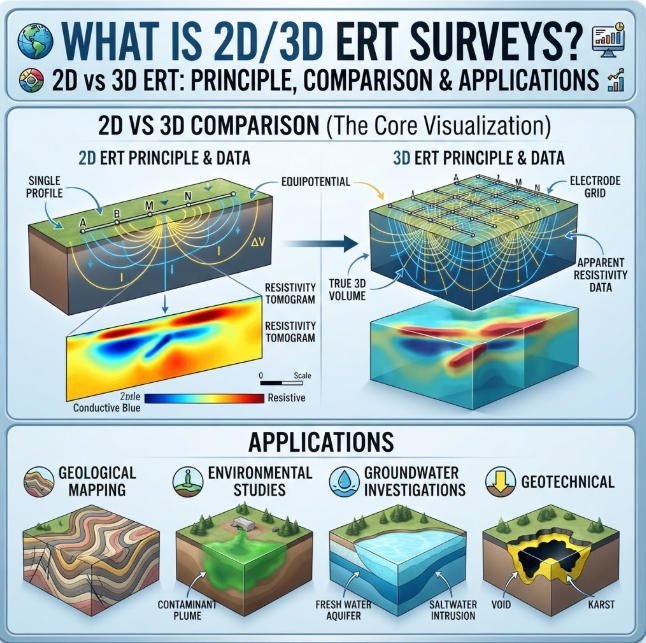
2D ERT deploys electrodes along a straight line and produces vertical cross-sectional profiles perpendicular to the surface. It assumes geological properties are uniform along the direction perpendicular to the survey line.
Strengths include cost-effective linear coverage, rapid deployment and straightforward interpretation. It is the standard approach for linear infrastructure corridors such as railway foundations, pipeline routes and tunnel alignments.
Limitations appear when dealing with complex 3D structures. Off-line features may be distorted, misplaced or missed entirely. Cave networks, irregular ore bodies and complex fault zones are poorly resolved by 2D profiles alone.
2. 3D Resistivity Imaging
3D ERT arranges electrodes in a two-dimensional grid pattern. Current injection and potential measurement occur across the full grid, sampling resistivity in all horizontal directions as well as with depth.
Cross-line layouts enable precise spatial modeling of complex subsurface bodies. The output is a volumetric resistivity model that can be sliced in any orientation for interpretation. This is critical for accurately mapping goaf zones, karst systems and irregular contaminant plumes.
Challenges include higher equipment requirements, longer acquisition times and computational demands. Advanced algorithms such as finite element forward modeling are required for accurate inversion of topographically complex 3D datasets.
Comparative Analysis
| Parameter | 2D Resistivity Imaging | 3D Resistivity Imaging |
|---|---|---|
| Electrode layout | Linear array | Areal grid |
| Output | Vertical cross-section | Volumetric data cube |
| Deployment speed | Fast (2–5 km/day) | Slow (0.5–1 km²/day) |
| Equipment requirement | 32–64 channel system | 128+ channel system |
| Interpretation complexity | Low to moderate | High |
| Target suitability | Linear features, layered geology | Complex 3D bodies, irregular targets |
| Relative cost | Low (1x baseline) | High (3–6x baseline) |
Ⅳ. Key Application Domains and Field Case Studies
Electromagnetic locator technologies serve across mining, engineering, environmental and utility sectors. The following case studies demonstrate typical field performance.
1. Coal Mine Goaf Detection
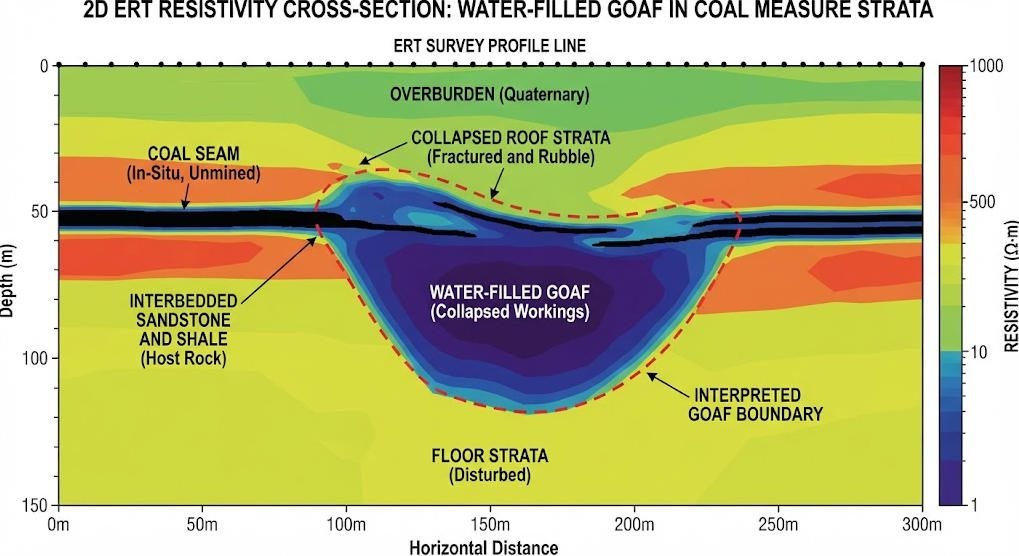
Abandoned mine goaf zones present major hazards for surface construction. Water-filled goaf typically shows low resistivity due to saturated fractured rock, while dry goaf may appear resistive.
Case Study: The WGMD-9 resistivity system was deployed for goaf detection in Hubei, China. The survey used Wenner array configurations with progressive electrode expansion. Pseudo-3D inversion of multiple parallel 2D lines identified low-resistivity anomalies corresponding to water-filled goaf boundaries.
Results successfully mapped the lateral extent and depth range of abandoned workings. Drilling verification confirmed 85% spatial agreement with interpreted goaf boundaries. Accuracy varies with depth, overburden thickness and goaf water content.
2. Karst Geological Survey
Karst terrain presents severe risks for deep foundation engineering. Solution fissures, caves and sinkholes create highly variable ground conditions that are difficult to detect by drilling alone.
Case Study: ERT surveys were conducted for pile foundation design in limestone terrain of Guangdong, China. High-resolution dipole-dipole profiles delineated dissolution fissures and karst conduit systems.
Intact bedrock returned high resistivity values, while water-bearing fractures and clay-filled caves appeared as conductive anomalies. The survey results optimized pile placement and reduced foundation risk. Follow-up drilling confirmed karst feature locations with 90% accuracy in the upper 30 m.
3. Underground Pipeline and Utility Mapping
Locating buried pipelines is a core application of electromagnetic locator technology. Metallic pipes are readily detected by their conductive signature. Non-metallic pipes present greater challenges.
Challenge: Non-metallic pipes such as PVC and HDPE have resistivity similar to surrounding soil, making them difficult to detect with standard conductivity methods. Dipole-dipole arrays provide enhanced sensitivity to small resistivity contrasts associated with pipe voids and backfill materials.
Best practice combines resistivity profiling with ground penetrating radar for utility surveys. ERT detects deeper and larger structures, while GPR provides high-resolution shallow imaging of smaller diameter pipes.
4. Additional Application Scenarios
Beyond the three core cases, electromagnetic locators serve many other sectors.
Archaeological surveys use high-resolution ERT to map buried foundations, pits and ditches without excavation. The non-destructive nature of the method is ideal for protected heritage sites.
Environmental investigations deploy combined resistivity and IP surveys to map landfill leachate plumes and distinguish clay liners from contaminant zones. Time-lapse surveys monitor plume migration over time.
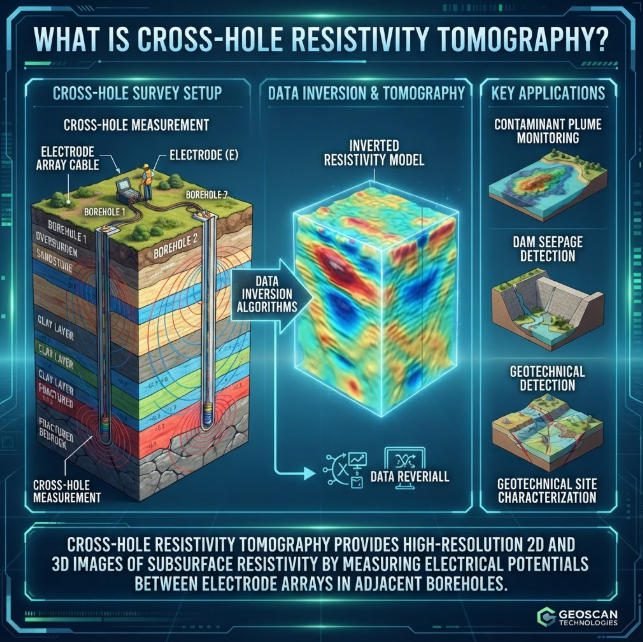
Geotechnical engineering uses ERT for dam seepage detection, levee integrity assessment and landslide slip surface identification. Weak zones and seepage pathways produce measurable resistivity anomalies.
Ⅴ. Forward Modeling and Inversion Technology
Data processing and interpretation rely on two core computational components: forward modeling and inversion.
1. Forward Modeling Approaches
Forward modeling calculates the theoretical surface response for a given subsurface resistivity distribution. It is the foundation of inversion algorithms.
Finite Element Method (FEM) modeling provides high accuracy for complex terrains, irregular topography and heterogeneous subsurface conditions. It can handle arbitrary resistivity distributions and surface geometry. The main drawback is computational intensity, especially for large 3D models.
Analytical solutions provide fast calculation for simple layered models. They work well for VES interpretation and horizontally uniform geology. They are computationally efficient but cannot handle complex structure or topography.
Hybrid approaches combine analytical solutions for regional fields with FEM for local complex zones. This balances speed and accuracy for many practical survey scenarios.
2. Inversion Algorithms
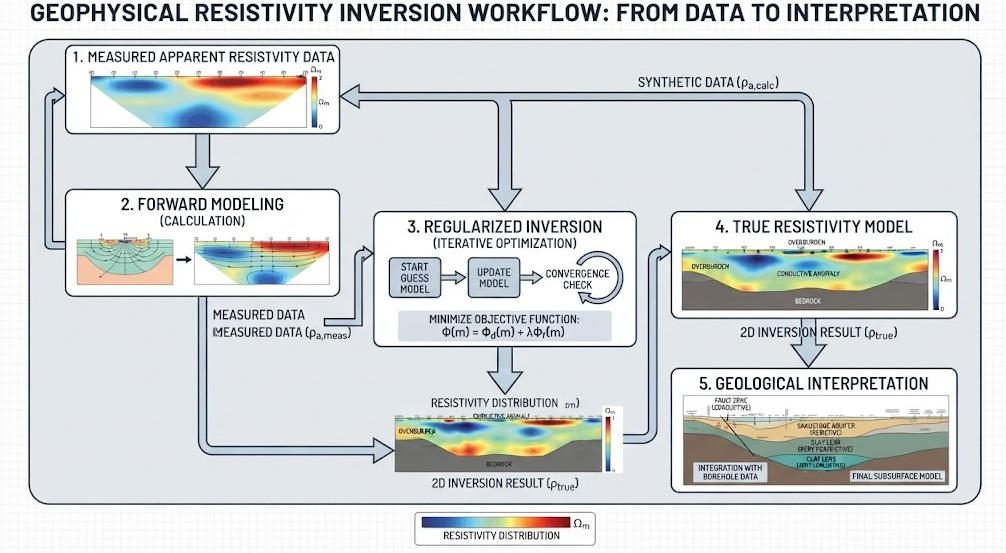
Inversion converts measured apparent resistivity data into true subsurface resistivity models. It is an ill-posed mathematical problem requiring regularization.
Regularized inversion using L2 norm smoothing produces stable, geologically plausible models. It minimizes data misfit while enforcing model smoothness. This is the standard approach for most commercial ERT software.
L1 norm regularization produces sharper, blockier models that may better represent sharp geological boundaries. It is more sensitive to noise and requires careful parameter tuning.
Advanced inversion packages include topography correction, anisotropy modeling and joint inversion with other geophysical data. Quality inversion always includes uncertainty estimation and convergence analysis.
Forward vs Inversion Comparison
| Component | Purpose | Common Methods | Performance Characteristics |
|---|---|---|---|
| Forward modeling | Calculate theoretical response from known model | FEM, analytical, finite difference | Accuracy depends on method; FEM most accurate for complexity |
| Inversion | Recover subsurface model from measured data | L2 regularized, L1 blocky, constrained | Ill-posed; requires regularization; non-unique solutions |
Ⅵ. Advantages, Limitations and Quality Control
1. Key Advantages
Electromagnetic locator methods offer several important benefits compared to other geophysical techniques.
Non-destructive investigation requires no drilling or excavation, making the method ideal for archaeological sites, populated areas and environmentally sensitive locations. Surveys can be repeated for time-lapse monitoring without disturbing the subsurface.
Multi-parameter fusion combines resistivity and IP data for improved target discrimination. This dual-property approach reduces ambiguity compared to single-parameter methods. It is particularly valuable for contaminant detection and mineral exploration.
Flexible deployment adapts to diverse site conditions. Electrode arrays can be configured for shallow or deep targets, linear or areal coverage, and rough terrain. Systems range from lightweight portable units to high-power deep-penetration systems.
2. Inherent Limitations
Electromagnetic locators have fundamental constraints that must be considered in project design.
Depth constraints limit standard surface systems to approximately 200 m maximum penetration. Deep VES with large electrode spreads can reach 500 m but with reduced resolution. Deeper targets require borehole methods or higher power systems.
Topographic noise affects data quality on steep slopes and rugged terrain. Elevation variations distort electrode geometry and current flow patterns. Modern inversion software includes topographic correction, but steep terrain still degrades results.
Non-uniqueness is a fundamental property of all resistivity methods. Different subsurface distributions can produce identical surface measurements. Interpretation must always be calibrated with geological knowledge and ground truth data.
Near-surface heterogeneity can mask deeper targets. Surface conductivity variations produce near-surface anomalies that may obscure or distort deeper features of interest.
3. Field Quality Control
Rigorous quality control ensures reliable electromagnetic locator data.
Pre-survey calibration includes instrument testing, electrode resistance verification and repeatability measurements at control stations. Electrode contact resistance should be consistently below acceptable thresholds.
Field procedures follow standardized acquisition parameters. Current levels, measurement stacking and cycle timing are documented for each survey segment. Real-time monitoring identifies bad data points during acquisition.
Post-processing includes bad data removal, drift correction and systematic error analysis. Reciprocal measurements quantify system bias and measurement repeatability.
All interpretations should include confidence levels. Features near resolution limits or depth limits should be identified as less certain. Ground-truth verification at selected locations is recommended for all critical projects.
Ⅶ. Typical Equipment and Selection Guide
1. WGMD-9 Multi-Function Resistivity System
The WGMD-9 is a mid-range electromagnetic locator system optimized for engineering and mining applications.
Key specifications include 48-channel acquisition, 1200 V maximum output voltage and 5 A maximum current. It supports Wenner, Schlumberger, dipole-dipole and pole-pole arrays for both ERT and VES surveys.
The system features built-in pseudo-3D inversion capability for multiple parallel lines. It is widely deployed for coal mine goaf detection, karst survey and general engineering geophysics.
2. High-Density ERT Systems
High-end multi-channel systems such as the GIM series support 128+ electrodes with simultaneous multi-channel acquisition. They deliver 10x higher data density than conventional systems.
These systems achieve 0.5 m scale resolution with 24-bit A/D conversion for high measurement accuracy. High-power options extend penetration to 1500 m for deep mineral exploration.
Roll-along acquisition and automated electrode switching maximize field productivity for large 2D and 3D surveys.
3. Selection Criteria
Selecting the right electromagnetic locator system depends on project requirements.
For general engineering surveys and standard depth targets, a 32–48 channel system with 500–1000 W output provides balanced performance and portability.
For deep exploration and 3D grid surveys, select 128+ channel systems with high-power transmitters. These support larger arrays and faster acquisition for volumetric imaging.
IP capability is recommended for mineral exploration, landfill investigations and clay-rich terrain. It adds significant interpretive value at moderate additional cost.
Accessory selection should match site conditions: stainless steel electrodes for general use, titanium electrodes for corrosive environments, and non-polarizing electrodes for IP surveys.
Ⅷ. Field Survey Best Practices
1. Survey Design Workflow
Effective electromagnetic locator surveys follow a structured design process.
First, define investigation objectives clearly: target depth, size, expected resistivity contrast and required location accuracy. These parameters determine method selection and survey parameters.
Second, select the appropriate method. Use VES for deep layered reconnaissance, 2D ERT for linear corridors and detailed profiles, and 3D ERT for complex volumetric targets.
Third, optimize electrode configuration and spacing. Smaller spacing gives higher resolution but shallower penetration. Array type should match target geometry: dipole-dipole for lateral features, Wenner for vertical resolution, Schlumberger for depth.
2. Field Execution Guidelines
Proper field execution maximizes data quality and survey effectiveness.
Lay out survey lines perpendicular to expected geological strike or target orientation. This maximizes intersection probability and improves feature definition.
Space control stations at regular intervals for repeatability measurements. These provide data quality benchmarks throughout the survey area.
Record all relevant field observations: lithology, surface conditions, cultural interference and access constraints. These contextual data are invaluable during interpretation.
For 3D surveys, maintain consistent grid geometry. Deviations from regular spacing degrade inversion quality and introduce artifacts.
3. Interpretation Best Practices
Electromagnetic locator interpretation requires both technical skill and geological judgment.
Always interpret resistivity data within the local geological context. Resistivity values alone do not identify lithology; they must be correlated with known geology from boreholes or outcrops.
Use multiple lines of evidence. Combine resistivity results with IP data, GPR, seismic or borehole information where available. Multi-method interpretation significantly reduces ambiguity.
Report confidence levels alongside interpretations. Clearly distinguish between well-resolved shallow features and deeper, less constrained anomalies.
Related Articles
| Title | Core Content | URL |
|---|---|---|
| 2D vs 3D Electrical Resistivity Tomography | Detailed comparison of 2D and 3D ERT technology, equipment, resolution and field applications | https://geotechcn.net/service/what-is-2d-3d-ert/ |
| Introduction to ERT and Time-Domain Induced Polarization | Covers ERT and TDIP principles, electrode arrays, data acquisition and environmental applications | https://geotechcn.net/service/ert-tdip-geophysical-survey/ |
| What is Vertical Electrical Sounding (VES)? | Explains DC resistivity sounding theory, Schlumberger array and stratigraphic investigation applications | https://geotechcn.net/service/what-is-ves-ert-systems/ |
| High-Density Electrical Resistivity Survey Principle | Details modern multi-channel ERT systems, inversion algorithms and engineering geology applications | https://geotechcn.net/service/electrical-method/ |
| Electrical vs Electromagnetic Survey Methods | Compares DC resistivity and electromagnetic geophysical methods across principles, equipment and use cases | https://geotechcn.net/service/electrical-vs-electromagnetic-survey/ |
Reference Sources
| Title | Core Content | URL |
|---|---|---|
| Electrical Resistivity Tomography | EPA technical reference covering resistivity principles, equipment, data interpretation and environmental site applications | https://www.epa.gov/environmental-geophysics/electrical-resistivity-tomography |
| Application of ERT for Abandoned Mine Characterization | USGS publication on ERT methods for abandoned mine detection and goaf mapping | https://pubs.usgs.gov/sir/2019/5076/ |
| ERT for Karst Feature Detection in Limestone Terrain | Peer-reviewed research evaluating electrical resistivity tomography for karst conduit and cave detection | https://academic.oup.com/jge/article/15/2/359/4826107 |
| Resistivity and IP Methods for Subsurface Utility Mapping | SEG technical paper on electromagnetic locator applications for buried pipeline and utility detection | https://wiki.seg.org/wiki/Resistivity_methods_for_near-surface_characterization |
| Resistivity Inversion Theory and Practice | University research reference covering forward modeling, regularized inversion and uncertainty analysis | https://vtechworks.lib.vt.edu/server/api/core/bitstreams/86b27899-05e2-4882-b31b-22e8b468d8d6/content |
FAQ
Q1: What is an electromagnetic locator used for in geophysics?
An electromagnetic locator detects and maps subsurface targets by measuring electrical property contrasts in the ground. It includes ERT, DC sounding and IP methods for imaging geological structures and buried objects. Common applications include mine goaf detection, karst survey, underground pipeline mapping and environmental site characterization.
Q2: What is the difference between ERT and DC resistivity sounding?
ERT produces 2D/3D resistivity images using dense electrode arrays for high-resolution detailed surveys. DC resistivity sounding generates 1D layered models by expanding electrode spacing at a single point. ERT excels at lateral feature mapping, while VES provides deeper penetration for stratigraphic analysis. Selection depends on target geometry and investigation objectives.
Q3: Can ERT detect non-metallic underground pipes?
ERT can detect non-metallic pipes under favorable conditions, though they are more challenging than metallic pipes. Dipole-dipole arrays enhance sensitivity to small resistivity contrasts from pipe voids and backfill materials. Detection success depends on pipe diameter, depth, backfill type and soil resistivity contrast. Best practice combines ERT with GPR for complete utility mapping.
Q4: How does induced polarization complement resistivity surveys?
Induced polarization measures secondary voltage decay to quantify subsurface chargeability, adding electrochemical property data beyond bulk resistivity. It helps distinguish clay-rich zones from saline groundwater and identifies metallic mineralization. Combined resistivity-IP surveys reduce interpretation ambiguity and improve target discrimination for mining and environmental projects.
Q5: What is the maximum depth of surface resistivity locators?
Standard surface electromagnetic locators typically reach 150–200 m maximum depth with conventional electrode arrays. Deep VES with large electrode spreads can extend to 500 m but with reduced resolution. High-power systems with long spreads achieve up to 1500 m for deep mineral exploration. Actual depth depends on array length, subsurface resistivity and target contrast.