Welcome to Geotech!
-1.png)


What is Cross-hole Resistivity?丨Cross-Hole Resistivity Tomography Technical Guide
TIPS:Cross-Hole Resistivity Tomography (CHERT) maps subsurface electrical properties between boreholes. This Cross-Hole ERT guide covers electrode arrays, field procedures, and engineering applications. Learn how Cross-Hole Resistivity Tomography delivers high-resolution imaging for geotechnical and environmental projects. Discover why Cross-Hole ERT outperforms surface methods at depth.
Ⅰ. What Is Cross-Hole Resistivity Tomography?
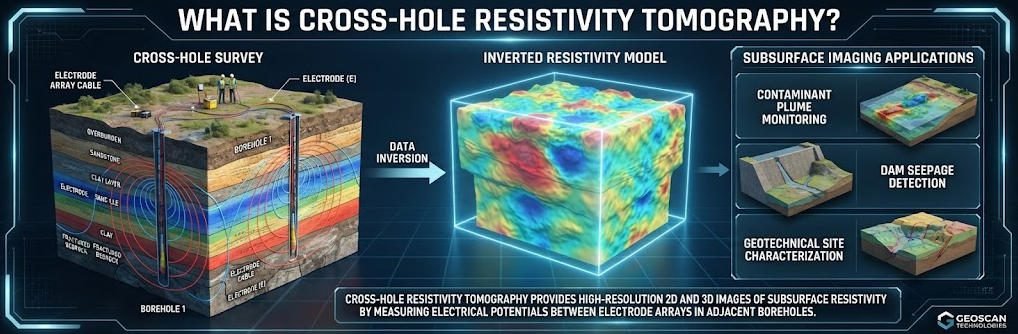
Cross-Hole Resistivity Tomography (CHERT) is a borehole geophysical method. It maps electrical resistivity distributions between boreholes using paired current and potential electrodes. CHERT overcomes the depth-resolution trade-off inherent in surface Electrical Resistivity Tomography (ERT). This guide explains the physics, array configurations, field procedures, and engineering applications of cross-hole resistivity imaging.
Cross-hole resistivity imaging places electrodes within boreholes rather than on the ground surface. This configuration brings sensors closer to the target zone. It improves signal fidelity and spatial resolution at depth. The method is widely used in geotechnical site investigation, mineral exploration, environmental monitoring, and groundwater studies.
Ⅱ. Physical Principles and Forward Modeling
1. Fundamental Physics
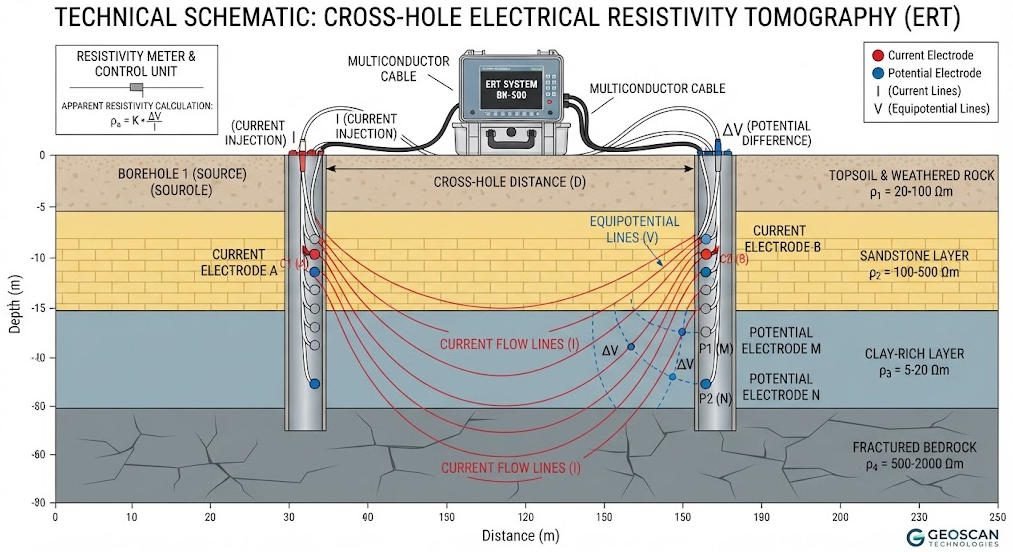
The fundamental physics of CHERT follows Ohm’s Law and the Poisson equation for electrical potential. A direct current is injected into the ground through two current electrodes. The resulting potential difference is measured between two potential electrodes. Apparent resistivity is calculated using a geometric factor that accounts for electrode spacing and arrangement.
In cross-hole configurations, electrodes are deployed along the entire length of multiple boreholes. Measurements are collected using various quadrupole combinations. Current and potential electrodes may be placed in the same borehole, in adjacent boreholes, or between boreholes and the surface. The choice of electrode configuration directly affects data quality, spatial resolution, and depth of investigation.
2. Governing Equations
The governing equation for DC resistivity forward modeling is the Poisson equation. In a homogeneous medium, the potential field satisfies Laplace’s equation. For heterogeneous media, the finite element method or finite difference method solves the forward problem numerically. These methods discretize the subsurface into cells and calculate the potential distribution for a given resistivity model.
Inversion algorithms transform measured apparent resistivity data into true resistivity models. The process is mathematically ill-posed. Regularization constraints are applied to stabilize the solution. Common inversion approaches include smoothness-constrained least squares, Occam’s inversion, and Gauss-Newton methods. Modern workflows increasingly incorporate time-lapse inversion and joint inversion with seismic or electromagnetic data.
Ⅲ. Electrode Array Configurations
1. Overview of Cross-Hole Arrays
Four primary electrode configurations dominate cross-hole ERT surveys. Each offers distinct advantages and limitations depending on geological conditions and survey objectives.
2. Pole-Pole Array
The pole-pole array uses one current electrode and one potential electrode. It provides the broadest current distribution and deepest penetration. However, it requires remote electrodes at infinity. This introduces systematic errors from finite electrode distances. The pole-pole array is rarely used in modern cross-hole surveys.
3. Pole-Dipole Array
The pole-dipole array places one current electrode in a borehole and a potential dipole in another. It offers a compromise between signal strength and spatial resolution. The AM-N configuration reduces remote electrode effects compared to pole-pole arrays. It remains sensitive to borehole spacing and electrode positioning errors.
4. Dipole-Dipole (AB-MN) Array
The dipole-dipole array places current and potential dipoles in different boreholes. The AB-MN configuration is straightforward to implement. However, it suffers from current channeling effects when conductive layers are present near electrodes. This distorts the current path and reduces imaging accuracy in complex geology.
5. Bipole-Bipole (AM-BN) Array
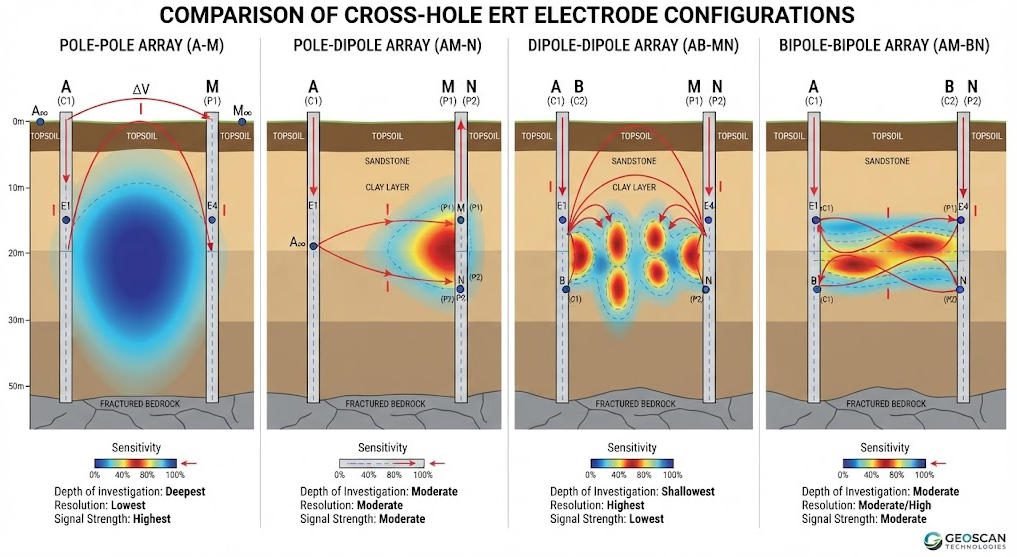
The bipole-bipole AM-BN configuration distributes electrodes of each dipole across different boreholes. Current electrodes A and B are placed in separate boreholes. Potential electrodes M and N are also separated across boreholes. Research demonstrates that the AM-BN scheme provides the most uniform sensitivity field. It minimizes artifacts near electrode arrays and performs well at larger borehole spacings.
The AM-BN configuration reduces current channeling effects. Current penetrates the inter-borehole region more effectively. Measurement electrodes remain closer to current electrodes in the same borehole. This yields stronger signals and improved signal-to-noise ratios. For these reasons, the AM-BN array is generally recommended for cross-hole ERT surveys.
6. Arrays to Avoid
Some configurations should be avoided in cross-hole surveys. Arrays with both current electrodes or both potential electrodes in the same borehole create singularity problems. These include pole-bipole A-MN, bipole-pole AB-M, and bipole-bipole AB-MN. They produce low potential readings that are easily obscured by background noise.
Ⅳ. Survey Design and Field Procedures
1. Borehole Spacing and Geometry
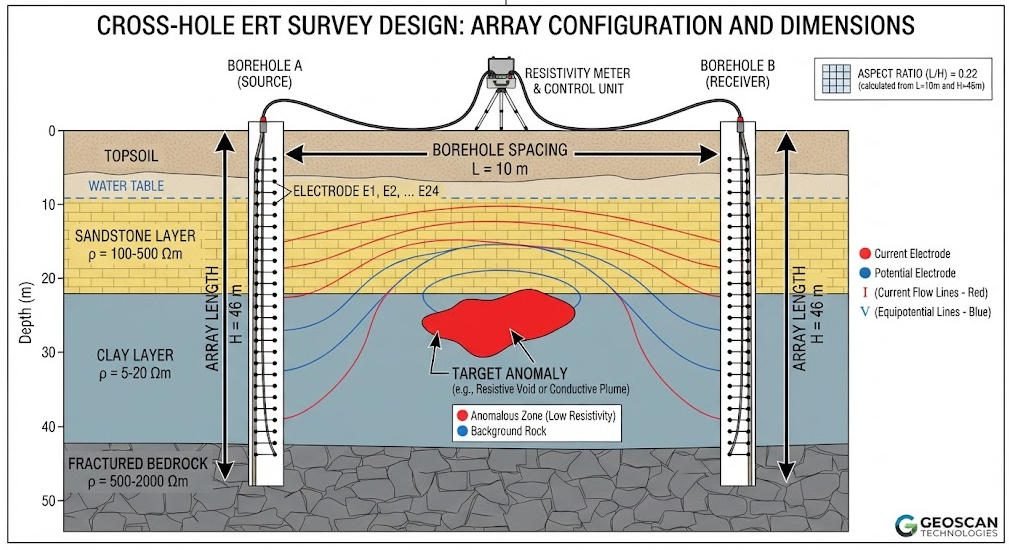
Borehole spacing is a critical design parameter. The separation between boreholes should not exceed approximately 0.75 times the length of the borehole electrode array. This rule ensures adequate sensitivity in the central region between boreholes. Wider spacing degrades resolution and increases inversion ambiguity.
Electrode spacing within boreholes typically ranges from 0.5 to 5 meters. Smaller spacing improves vertical resolution but increases acquisition time. Larger spacing extends the depth range but reduces the ability to resolve thin layers. The optimal spacing depends on target dimensions, depth, and the contrast between geological units.
The aspect ratio of equipped borehole length to borehole separation must be maintained. An aspect ratio of approximately 0.75 has been demonstrated to image heterogeneous plumes effectively. Using 13 electrodes per borehole with spacing a, researchers have successfully imaged plumes 5a thick and 4a wide.
2. Borehole Conditions and Coupling
Cross-hole ERT requires water-filled or mud-filled boreholes for electrical coupling. The borehole fluid affects measurements through the borehole fluid effect. Conductive drilling mud can create artifacts in inversion images. The complete electrode model accounts for finite electrode size and borehole fluid conductivity. This improves inversion accuracy compared to point-electrode approximations.
Borehole deviation presents a significant challenge. Actual electrode positions differ from assumed vertical locations. Random and systematic offsets in electrode positions introduce errors. Borehole deviation surveys are essential for accurate modeling. Without deviation correction, inversion artifacts appear near boreholes.
3. Data Acquisition Workflow
Field procedures for cross-hole ERT follow a systematic workflow. First, boreholes are drilled to the target depth. Deviation surveys record actual borehole trajectories. Electrode arrays are lowered into boreholes and coupled to the formation. The resistivity meter collects measurements using the selected array configuration. Data quality is monitored through reciprocal measurements and stacking errors.
Reciprocal measurements swap current and potential dipoles. In a noise-free system, reciprocal data should be identical. Discrepancies indicate data quality issues. Reciprocal errors typically should remain below 5 percent for reliable inversion. Higher errors suggest poor electrode contact, cultural noise, or instrument malfunction.
Ⅴ. Resolution and Imaging Performance
1. Depth Resolution Advantage
Cross-hole ERT achieves significantly higher resolution at depth than surface ERT. Surface ERT resolution degrades rapidly with depth. The investigation depth is limited to approximately one-fifth of the array length for four-pole arrays. Cross-hole configurations place electrodes at depth. This maintains sensitivity in the target zone.
The resolution of cross-hole ERT is not uniform. Sensitivity is highest near boreholes. It decreases toward the center of the inter-borehole region. Smoothness regularization in inversion tends to blur features between boreholes. Regularization disconnects and borehole conductivity constraints can improve spatial resolution.
2. Time-Lapse Monitoring
Time-lapse cross-hole ERT monitors temporal changes in resistivity. Baseline surveys establish background conditions. Repeat surveys track changes from tracer injections, groundwater fluctuations, or grouting operations. Difference inversion highlights resistivity changes while suppressing static geological features.
Ⅵ. Engineering and Scientific Applications
1. Mineral Exploration
Cross-hole ERT has proven effective for multiple engineering and scientific applications. In mineral exploration, it delineates conductive ore bodies between boreholes. Cross-borehole tomography has mapped massive sulfide zones up to 130 meters apart. The method requires water-filled boreholes for electrode coupling.
2. Geotechnical Engineering
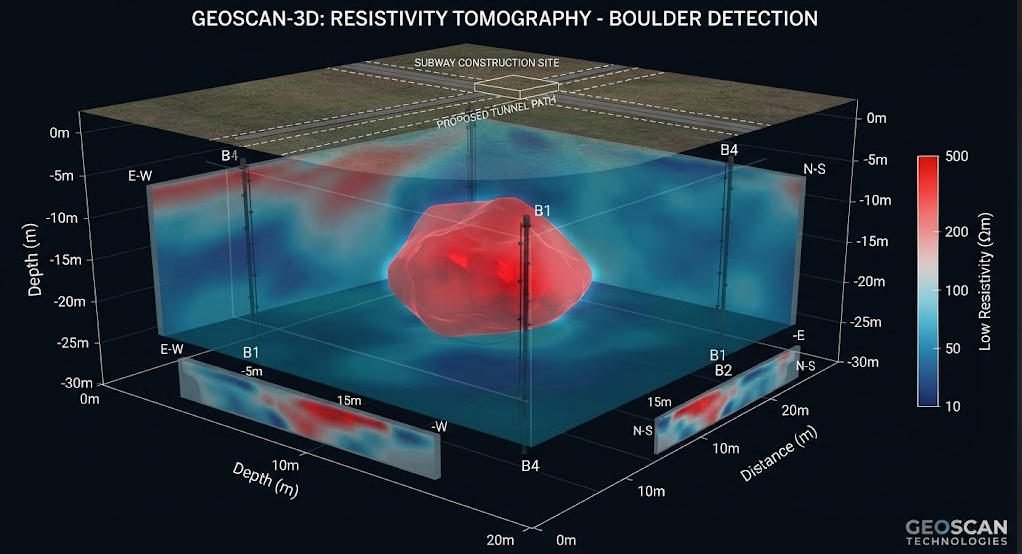
In geotechnical engineering, CHERT detects cavities, voids, and fractured zones. A case study in subway construction used 3D cross-hole ERT with four boreholes. The AM-BN configuration successfully detected isolated boulders with resistivity contrasts exceeding 2000 ohm-meters against surrounding rock of less than 500 ohm-meters.
3. Environmental Monitoring
For environmental monitoring, cross-hole ERT tracks contaminant plumes and seawater intrusion. Time-lapse surveys monitor saltwater wedge migration in coastal aquifers. The method detects resistivity changes as small as 10 percent under favorable conditions.
4. CO2 Geological Storage
In CO2 geological storage, cross-borehole ERT monitors plume migration. Field-scale projects in Germany and the United States have implemented CHERT for long-term monitoring. The method tracks CO2-induced resistivity increases in saline formations.
5. Dam Safety Assessment
For dam safety assessment, cross-hole ERT identifies seepage pathways and internal erosion. The method maps preferential flow paths through embankments and foundations. Time-lapse monitoring detects developing leaks before surface manifestations appear.
Ⅶ. Advantages, Limitations, and Integration
1. Method Advantages
Cross-hole ERT offers distinct advantages over surface methods. It provides higher resolution at depth. It reduces sensitivity to near-surface noise and topography. It enables 3D imaging when multiple boreholes are available. It supports continuous monitoring through permanent electrode installations.
2. Method Limitations
However, cross-hole ERT also has important limitations. It requires existing or newly drilled boreholes. This increases survey cost compared to surface methods. Borehole spacing limits the volume that can be imaged. Borehole fluid effects and deviation errors can introduce artifacts. Resolution between boreholes remains lower than near-borehole regions.
3. Multi-Method Integration
Integration with complementary methods strengthens interpretation. Cross-hole seismic tomography provides velocity information. Joint inversion of resistivity and velocity data reduces ambiguity. Borehole logging data constrain inversion models. Surface ERT or TEM surveys provide regional context.
Ⅷ. Equipment, Processing, and Quality Assurance
1. Instrument Selection
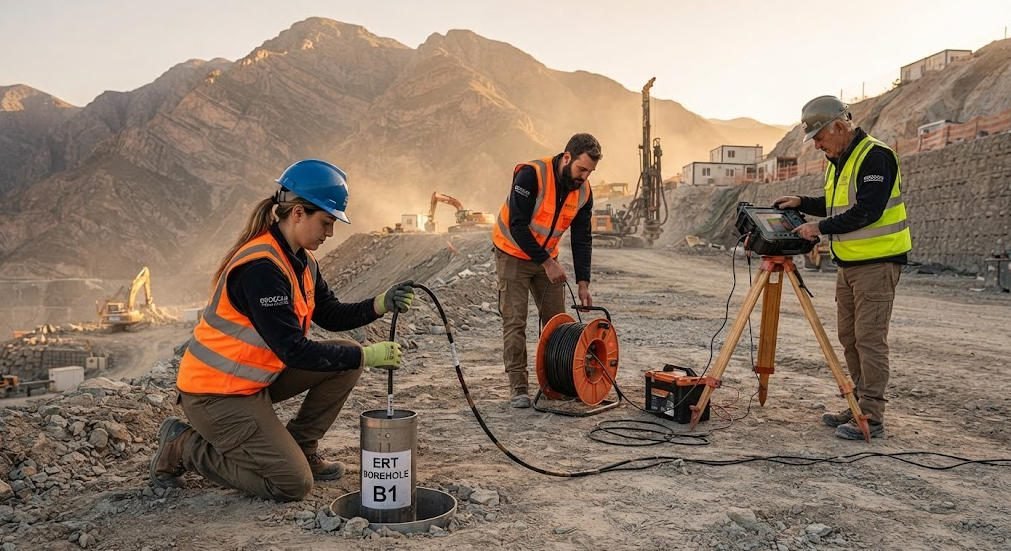
Equipment selection depends on project requirements. Multi-channel resistivity meters accelerate data acquisition. The number of channels determines how many measurements can be collected simultaneously. Modern systems support 12 to 120 channels for high-density surveys.
Power requirements vary with target depth and borehole spacing. Deeper targets and wider spacing require higher transmitter power. Typical systems provide 1000 to 5000 watts. Voltage ranges from 400 to 1200 volts. Current output reaches 2 to 6 amperes.
2. Software and Inversion
Data processing requires specialized inversion software. Commercial packages include RES2DINV, RES3DINV, and EarthImager. Open-source alternatives include pyGIMLi and SimPEG. Software selection depends on dimensionality, array type, and desired constraints.
3. QA/QC Protocols
Quality assurance protocols ensure reliable results. Pre-survey modeling optimizes array design. Field checks verify electrode contact resistance. Reciprocal measurements assess data quality. Sensitivity analysis evaluates model resolution. Independent borehole data validate interpretation.
Ⅸ. Future Directions
Future developments in cross-hole ERT focus on several directions. Distributed acoustic sensing fiber optics may complement electrical measurements. Machine learning algorithms accelerate inversion and improve artifact suppression. Real-time monitoring systems enable adaptive survey optimization. Multi-physics integration combines electrical, seismic, and electromagnetic data.
Cross-hole resistivity tomography remains an essential tool for subsurface characterization. It bridges the gap between point-scale borehole data and regional-scale surface geophysics. Proper survey design, careful field execution, and rigorous data processing yield reliable 3D resistivity models. These models support critical decisions in resource exploration, civil engineering, and environmental protection.
Ⅹ. Practical Implementation Guidelines
1. Survey Design Considerations
Survey design requires careful consideration of geological objectives. The target depth determines required borehole depth. Target dimensions influence electrode spacing. Expected resistivity contrast affects the ability to detect anomalies. Cultural noise sources may limit measurement quality.
Pre-survey numerical modeling optimizes array geometry. Synthetic data are generated for expected geological scenarios. Different configurations are tested to evaluate sensitivity and resolution. This modeling identifies the optimal borehole layout and measurement protocol before fieldwork begins.
2. Field Deployment
Field deployment requires trained personnel and proper equipment. Electrode cables must withstand borehole conditions. Depth markers ensure accurate electrode positioning. Centralizers keep electrodes away from borehole walls. Packers may isolate specific depth intervals for targeted measurements.
Data acquisition proceeds systematically. The resistivity meter cycles through all electrode combinations. Acquisition time depends on the number of electrodes and stacking repeats. A typical cross-hole survey with 30 electrodes per borehole may collect thousands of measurements. Full data sets require several hours to acquire.
Real-time quality monitoring prevents costly rework. Field software displays pseudosections during acquisition. Outliers and noisy measurements are flagged immediately. Crews can adjust parameters or repair connections without delaying the project.
3. Data Processing and Interpretation
Post-processing begins with data editing. Bad measurements are removed. Reciprocal pairs are compared. Error models are constructed from stacking errors and reciprocal discrepancies. These errors guide the inversion weighting scheme.
Inversion parameters require careful selection. The regularization factor balances data fit and model smoothness. Starting models influence convergence. Reference models from borehole logs constrain the solution. L-curve analysis helps select optimal regularization.
3D inversion is preferred when multiple boreholes are available. It captures the true geometry of geological features. 2D inversion of individual borehole pairs may be used for reconnaissance. However, 2D assumptions can misrepresent 3D structures.
Interpretation combines geophysical images with geological knowledge. Resistivity values are correlated with lithology from boreholes. Anomalies are classified based on shape, magnitude, and geological context. Uncertainty estimates from sensitivity analysis guide confidence levels.
4. Reporting and Deliverables
Reporting should include methodology, data quality metrics, inversion parameters, and interpretation. Figures should show electrode locations, data coverage, sensitivity distribution, and final resistivity models. Cross-sections and fence diagrams communicate results to non-specialists.
Cost considerations influence method selection. Cross-hole ERT requires boreholes, which represent a major expense. However, the information gained between boreholes often justifies the cost. The method reduces uncertainty in geotechnical design. It targets remediation efforts in environmental projects. It guides drilling programs in mineral exploration.
Safety protocols protect field crews and equipment. High-voltage electrical systems require insulated handling. Borehole operations follow standard drilling safety practices. Hazardous sites require environmental monitoring and personal protective equipment.
Regulatory compliance may apply to certain applications. Groundwater monitoring projects may require permits. Nuclear waste sites follow strict quality assurance standards. International projects must comply with local regulations and import requirements.
Training and experience are essential for successful implementation. Data acquisition requires understanding of instrument operation. Inversion demands knowledge of geophysical theory. Interpretation benefits from geological expertise. Multi-disciplinary teams deliver the best results.
The method continues to evolve. Advances in electronics enable more channels and faster acquisition. Improved algorithms provide better resolution and reliability. Integration with other technologies expands application possibilities. Cross-hole resistivity tomography will remain a cornerstone of subsurface investigation for years to come.
5. Special Environments and Considerations
In fractured rock environments, cross-hole ERT faces unique challenges. Electrical current follows fracture networks. This creates complex current paths that violate smoothness assumptions. Standard inversion may produce misleading images. Specialized regularization or explicit fracture modeling may be needed.
The borehole itself affects measurements. Open boreholes filled with conductive fluid create low-resistivity pathways. Current channeling along boreholes distorts the potential field. The complete electrode model includes borehole geometry and fluid conductivity. This reduces artifacts in the final image.
Permanent electrode installations enable long-term monitoring. Electrodes are cemented into boreholes or installed in dedicated monitoring wells. Automated data acquisition systems collect measurements at regular intervals. This approach is valuable for dam safety, landfill monitoring, and CO2 storage verification.
Temperature effects must be considered in some applications. Groundwater temperature changes alter fluid conductivity. Seasonal variations may produce apparent resistivity changes unrelated to target processes. Temperature correction factors should be applied when interpreting time-lapse data.
Metallic infrastructure near survey sites can interfere with measurements. Buried pipes, cables, and reinforced concrete create conductive anomalies. These may mask or mimic geological features. Pre-survey site reconnaissance identifies potential interference sources. Survey design may need to avoid or account for these features.
Project managers should evaluate whether cross-hole ERT fits their specific needs. Existing boreholes reduce cost. New drilling requires budget allocation. Target depth and required resolution determine technical feasibility. Integration with other site data strengthens confidence in results.
Selecting the right contractor is critical for project success. Experienced providers understand array optimization and deviation correction. They maintain calibrated instruments and trained field crews. They deliver quality-controlled data with documented uncertainty estimates.
The deliverables from a cross-hole ERT survey typically include raw data files, processed inversion models, and interpretive reports. Raw data should include measurement configurations, apparent resistivity values, and quality metrics. Inversion models should be provided in standard formats compatible with visualization software. Reports should explain methodology, present results, and discuss limitations.
Clients should request sensitivity analysis alongside inversion results. Sensitivity maps show where the data constrain the model. Low-sensitivity regions carry higher uncertainty. This information prevents over-interpretation of poorly resolved features.
Cross-hole ERT represents a mature technology with proven field performance. It fills a critical niche between borehole logging and surface geophysics. Understanding its capabilities and limitations allows geoscientists to deploy it effectively. The method delivers high-value subsurface information when applied with proper expertise.
Collection of related articles
| Content Titles | URL |
|---|---|
| Electrical Resistivity Tomography fundamentals | https://geotechcn.net/service/geophysical-methods-ert-guide/ |
| ERT vs TEM method selection | https://geotechcn.net/service/ert-vs-tem-guide/ |
| ERT equipment specifications | https://geotechcn.net/service/what-is-ert-equipment/ |
| GIM-5 multi-channel resistivity system | https://geotechcn.net/products/electrical-instrument/gim-5-multi-channel/ |
| ERT instrument technical guide | https://geotechcn.net/service/ert-equipment-explained/ |
| Abandoned mine tunnel detection case | https://geotechcn.net/application/application-of-electrical-resistivity-tomography-ert/ |
| EM resistivity principles | https://geotechcn.net/service/em-resistivity-principles/ |
Reference Sources
| Source institution | Title | URL |
|---|---|---|
| USGS | Borehole Geophysics — U.S. Geological Survey | https://www.usgs.gov/centers/new-york-water-science-center/science/borehole-geophysics |
| EPA CLU-IN | Electrical Resistivity Tomography — Technology Overview | https://clu-in.org/characterization/technologies/default2.focus/sec/Geophysical_Methods/cat/Electrical_Resistivity_Tomography/ |
| SEG | Society of Exploration Geophysicists — Near-Surface Geophysics | https://seg.org/Portals/0/SEG/Documents/Publications/Books/Near-Surface-Geophysics/NSG_all.pdf |
| AGU / Wiley | Cross-hole resistivity tomography using different electrode configurations (Geophysical Prospecting) | https://onlinelibrary.wiley.com/doi/10.1046/j.1365-2478.2000.00220.x |
| HESS (Copernicus) | Time-lapse cross-hole ERT for monitoring seawater intrusion dynamics | https://hess.copernicus.org/articles/24/2121/2020/ |
FAQ
Q1: What is cross-hole resistivity tomography?
Cross-hole resistivity tomography (CHERT) is a geophysical method that maps electrical resistivity between boreholes. It places electrodes in drill holes rather than on the surface. This brings sensors closer to deep targets. It improves resolution at depth where surface ERT loses sensitivity. CHERT is used for cavity detection, contaminant monitoring, and mineral exploration.
Q2: What is the optimal borehole spacing for cross-hole ERT?
Borehole spacing should not exceed 0.75 times the electrode array length. This rule maintains adequate sensitivity in the central region. Wider spacing causes resolution degradation. For example, a 20-meter array allows approximately 15-meter spacing. Pre-survey modeling should confirm the design for specific geological conditions.
Q3: Which electrode array is best for cross-hole surveys?
The bipole-bipole AM-BN array is generally recommended. It provides the most uniform sensitivity field. Current electrodes in separate boreholes reduce channeling effects. Potential electrodes capture stronger signals. The AM-BN configuration outperforms AB-MN and pole-pole arrays in most geological settings.
Q4: Can cross-hole ERT detect small cavities or fractures?
Detection depends on cavity size, depth, and resistivity contrast. Under favorable conditions, CHERT resolves features at the scale of electrode spacing. However, smoothness regularization in inversion tends to blur small features between boreholes. Borehole deviation and fluid effects may also limit resolution. Combining CHERT with borehole logging improves detection confidence.
Q5: How does cross-hole ERT compare to surface ERT?
Cross-hole ERT provides higher resolution at depth. Surface ERT investigation depth is limited to about one-fifth of array length. Cross-hole configurations avoid near-surface noise. However, CHERT requires boreholes, which increases cost. Surface ERT remains preferable for reconnaissance and large-area coverage. The methods are often combined for optimal results.