Welcome to Geotech!
-1.png)


2D vs 3D ERT: Complete Field Guide
TIPS:Electrical resistivity tomography (ERT) delivers high-resolution subsurface mapping for geophysical surveys. This guide compares 2D and 3D resistivity imaging workflows, equipment needs, and cost structures. Learn how electrical resistivity tomography solves real-world problems in engineering and environmental projects. Discover which resistivity imaging method—2D ERT or 3D ERT—matches your site conditions and budget.
Ⅰ. Introduction
Electrical resistivity tomography (ERT) is a non-invasive geophysical method. It maps subsurface resistivity variations by injecting direct current into the ground and measuring voltage differences. This technique creates 2D cross-sections or 3D volumetric models. Engineers and geophysicists use it for environmental, civil engineering, and mining projects.
Choosing between 2D ERT and 3D ERT affects your survey accuracy, timeline, and budget. This guide explains both resistivity imaging methods in plain technical language. You will learn acquisition workflows, processing steps, and real-world applications. By the end, you can select the right electrical resistivity tomography approach for your project.
Ⅱ. What Is Electrical Resistivity Tomography?
1.Basic Physics
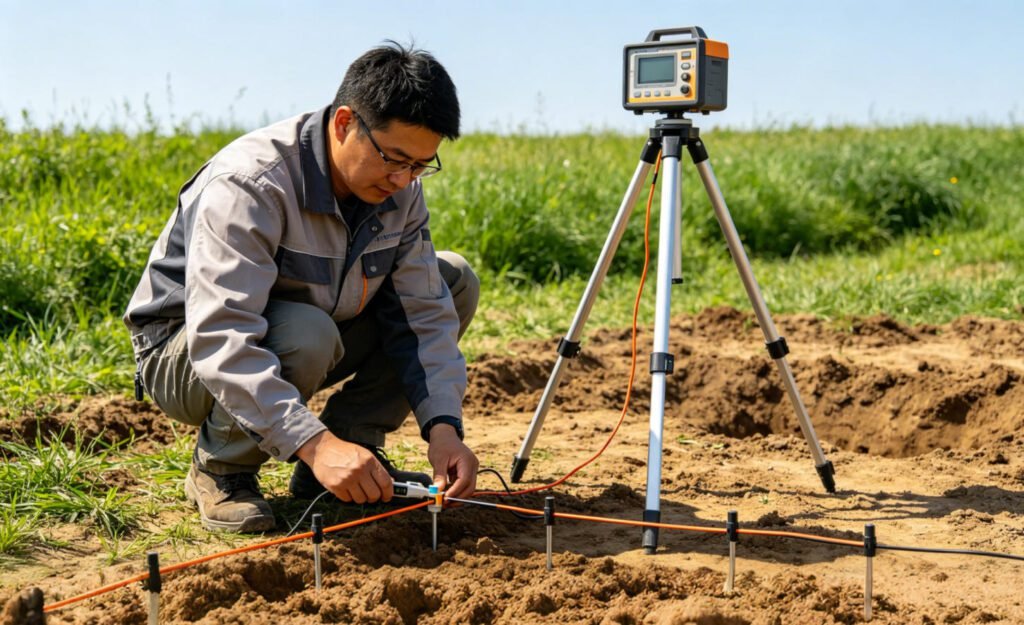
ERT relies on Ohm’s law. Current flows through the ground between two electrodes. Potential electrodes measure the voltage drop. The instrument calculates apparent resistivity. Different materials return different values. Clay shows low resistivity. Granite shows high resistivity. Water-saturated zones also show low values.
2.Why ERT Matters
Traditional drilling provides point data only. Electrical resistivity tomography delivers continuous profiles. It covers large areas without excavation. This saves time and reduces site disturbance. For these reasons, ERT has become a standard geophysical survey technique worldwide.
Ⅲ. 2D ERT: The Linear Profiling Method
1.How It Works
2D ERT uses a linear electrode array. Technicians plant electrodes along a straight line. Common configurations include Wenner, Schlumberger, and dipole-dipole arrays. The resistivity meter switches current and potential pairs automatically. It collects thousands of measurements in minutes.
2.Data Processing Workflow
Forward modeling simulates the expected response. You build a synthetic subsurface model. The software predicts voltage readings. This step validates your survey design.
Inverse modeling converts field data into a resistivity model. The algorithm adjusts layer properties until predicted and observed data match. Res2DInv and pyGIMLi handle this task efficiently. Processing usually takes minutes to hours.
3.Typical Use Cases
2D ERT works best for linear targets. These include dam seepage lines, roadbed investigations, and pipeline routes. It also suits slope stability studies. The method is fast and cost-effective. A one-kilometer survey often finishes in one day.
Ⅳ. 3D ERT: The Volumetric Mapping Method
1.Grid Array Setup
3D ERT requires electrodes arranged in a grid. Common layouts include 10 × 10 or 20 × 20 arrays. Cables run in parallel lines. The system collects data along and across the lines. This captures lateral variations that 2D surveys miss.
2.Advanced Inversion
3D inverse modeling uses finite element or finite difference meshes. The Gauss-Newton algorithm iteratively updates the model. High-performance computing clusters speed up this process. Software options include AGI EarthImager and RES3DINV. Processing may take several hours to days.
3.When 3D Wins
Choose 3D ERT for complex sites. These include landfill leak detection, mineral ore body mapping, and archaeological site surveys. The volumetric view reveals anomaly depth, width, and orientation. This precision reduces drilling costs later.
Ⅴ. Head-to-Head Comparison
1.Resolution and Accuracy
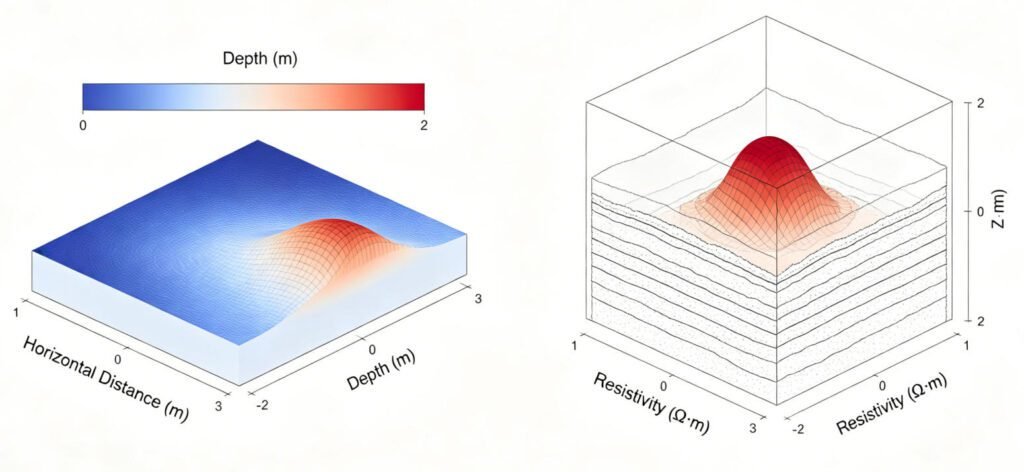
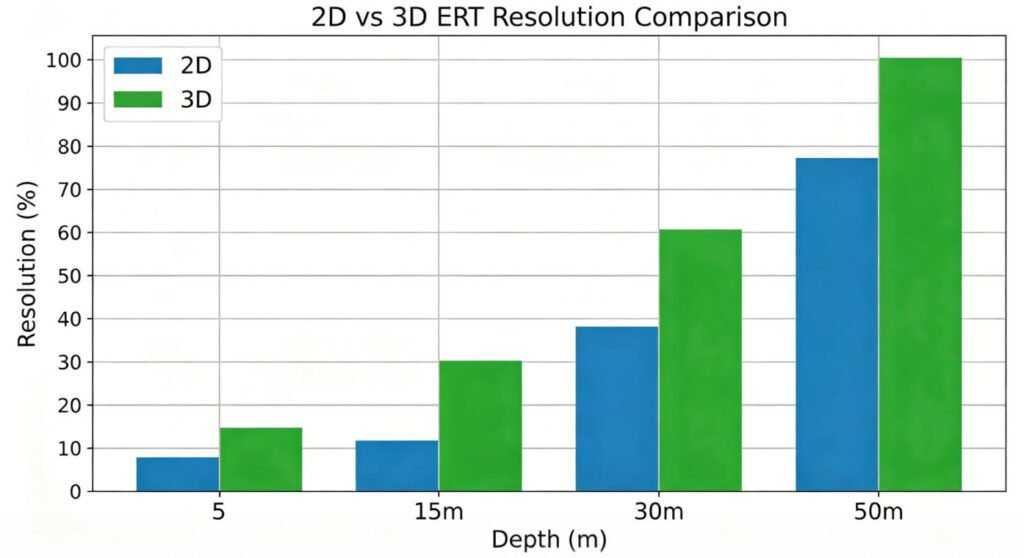
2D ERT offers vertical resolution of roughly 5–10% of electrode spacing. Horizontal resolution degrades with depth. Out-of-plane anomalies create artifacts. This is called the “smearing” effect.
3D ERT achieves 1–5% resolution in all directions. It removes off-line artifacts. The result is a truer picture of subsurface structures. For critical projects, this accuracy justifies the extra cost.
2.Survey Time and Cost
A 2D survey needs 1–2 days in the field. Equipment costs stay low. You need one cable set and a basic resistivity meter.
A 3D survey needs 3–7 days for a 100 m × 100 m grid. It demands more electrodes, cables, and staff. Data processing adds further expense. However, 3D data often reduces the number of confirmation boreholes. This offsets the upfront investment.
3.Software and Hardware
| Feature | 2D ERT | 3D ERT |
|---|---|---|
| Electrode layout | Single line | Grid or multiple lines |
| Typical depth | Up to 100 m | Up to 50 m |
| Field time | 1–2 days | 3–7 days |
| Processing time | Minutes to hours | Hours to days |
| Software | Res2DInv, pyGIMLi | AGI EarthImager, RES3DINV |
| Cost level | Lower | Higher |
Ⅵ. Real-World Applications and Case Studies
1.Environmental Remediation
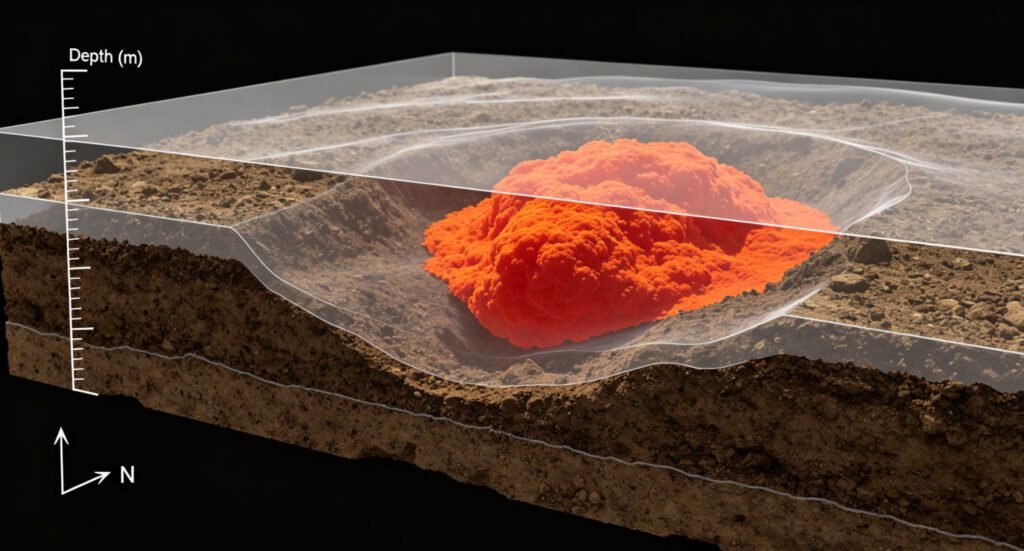
A USGS team used 3D electrical resistivity tomography in California. They mapped a chlorinated solvent plume beneath an industrial site. The 3D model showed the plume at 15–30 m depth. It also revealed lateral spread toward a nearby creek. Remediation teams used this data to place injection wells precisely. Cleanup time dropped by 30%.
2.Civil Engineering and Tunnel Safety
Swiss railway engineers faced a tunnel expansion project. They needed to check for voids behind the lining. 2D ERT profiles detected a water-filled cavity at 12 m depth. The team grouted the void before excavation began. This low-cost resistivity imaging survey prevented a potential collapse.
3.Archaeological Exploration
Researchers at Texas A&M University surveyed a historic site in Texas. They searched for a buried 18th-century fort wall. 3D ERT located the foundation at 1.5 m depth. The data showed wall orientation and length. Archaeologists opened only one small trench. They confirmed the find without destroying the surrounding area.
Ⅶ. Equipment Selection Guide
1.Resistivity Meters
Multi-channel systems speed up data collection. Look for units with at least 8 channels for 3D work. Built-in GPS and remote triggering help large grids. Geotech offers rugged meters designed for field conditions.
2.Electrode Arrays
Stainless steel electrodes resist corrosion. Use spike electrodes for soft ground. Plate electrodes work on hard surfaces. For 3D surveys, ensure all electrodes have consistent contact resistance.
3.Cables and Connectors
Heavy-duty cables survive rough terrain. Quick-connect clips reduce setup time. Always carry spare segments. A broken cable can halt an entire survey day.
Ⅷ. Challenges and Limitations
1.Interpretation Ambiguity
Similar resistivity values can mean different materials. Clay and saline water both show low resistivity. You need geological knowledge to distinguish them. Always ground-truth with at least one borehole.
2.Depth Limits
Signal strength drops with distance. 2D ERT rarely exceeds 100 m depth. 3D ERT typically reaches 50 m. Deeper targets require larger electrode spacing or alternative methods like seismic refraction.
3.Topography Effects
Hilly terrain distorts current flow. Modern software includes topographic correction. Always collect elevation data during the survey. Skip this step and your model will contain false anomalies.
Ⅸ. Future Trends in Resistivity Imaging
1.Machine Learning Integration
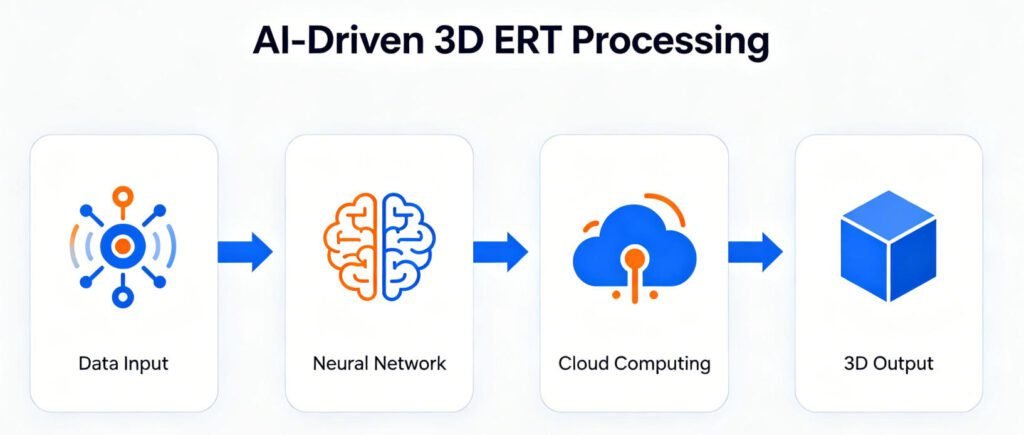
AI algorithms now assist 3D inversion. Neural networks predict starting models. This reduces processing time by 40–60%. Some platforms auto-classify lithology from resistivity ranges.
2.Time-Lapse Monitoring
Permanent electrode arrays enable repeat surveys. Engineers monitor dam seepage or landfill leaks over months. Changes between surveys appear as difference maps. This trend is growing in smart infrastructure projects.
3.Hybrid Geophysical Surveys
Teams now combine ERT with ground-penetrating radar (GPR) or seismic methods. Each technique senses different physical properties. Fusion models improve confidence in final interpretations.
Ⅹ. Conclusion
2D and 3D electrical resistivity tomography methods serve different needs. 2D ERT offers speed and low cost for linear projects. 3D ERT delivers precision for complex, multi-directional sites. Both rely on solid forward and inverse modeling workflows.
Your choice depends on target complexity, budget, and timeline. For roadbeds and pipelines, 2D often suffices. For landfills, mines, and detailed site investigations, 3D pays back through reduced drilling.
Advances in computing and AI are narrowing the gap. Processing times for 3D resistivity imaging continue to drop. In the near future, real-time 3D inversion may become standard field practice.
For resistivity meters, electrodes, and software solutions, explore the Geotech product range.
References
- USGS (U.S. Geological Survey): https://www.usgs.gov/energy-and-minerals/mineral-resources-program/science/electrical-resistivity-tomography
- USGS Water Resources: https://www.usgs.gov/mission-areas/water-resources
- SEG (Society of Exploration Geophysicists) :https://seg.org/
- Texas A\&M University – Archaeological Survey: https://anthropology.tamu.edu/
- University of Bonn / GitHub: https://www.pygimli.org/
- Res2DInv Official Documentation: https://www.geotomosoft.com/
- Federal Highway Administration (FHWA): https://www.fhwa.dot.gov/
FAQ
Q1: What is the main difference between 2D and 3D ERT?
A: 2D ERT uses a linear electrode array. It creates a vertical cross-section along one line. 3D ERT uses a grid array. It creates a volumetric model showing X, Y, and Z variations. 3D captures off-line anomalies. 2D is faster and cheaper.
Q2: How deep can electrical resistivity tomography surveys reach?
A: 2D ERT typically reaches 100 m. 3D ERT usually reaches 50 m. Depth depends on electrode spacing and ground resistivity. Large spacing increases depth but reduces resolution.
Q3: Which software is best for ERT data processing?
A: Res2DInv and pyGIMLi work well for 2D data. AGI EarthImager and RES3DINV handle 3D inversion. Open-source tools suit research budgets. Commercial packages offer faster support and advanced meshing.
Q4: Can ERT detect groundwater and contamination?
A: Yes. Water-saturated zones show low resistivity. Contaminants like hydrocarbons or salts alter resistivity signatures. ERT maps water tables, aquifer boundaries, and pollution plumes effectively.
Q5: Is 2D ERT or 3D ERT more cost-effective?
A: 2D ERT has lower upfront costs. Fieldwork and processing are faster. 3D ERT costs more initially. However, it often reduces confirmation drilling. For complex sites, 3D ERT delivers better long-term value.