Welcome to Geotech!
-1.png)


Centralized High-Density Electrical Method System: Technical Principle and Case Analysis
TIPS:High-density resistivity method technology transforms subsurface imaging for engineers. This electrical resistivity tomography guide explains how the high-density resistivity method captures 2D and 3D geological structures. You will learn electrical resistivity tomography system architecture and real karst detection results. We cover 6600W power specs and field workflows for high-density resistivity method professionals.
Ⅰ. What Is the High-Density Resistivity Method
The high-density resistivity method is an array-based exploration system. It evolved from traditional DC resistivity methods. The technique establishes an artificial electric field through strategically deployed electrodes. It measures spatial resistivity variations to infer subsurface geological structures.
This method integrates vertical electrical sounding and horizontal profiling. Advanced inversion algorithms convert raw data into 2D resistivity images. Some systems extend this to 3D volumetric imaging.
The global earth resistivity meter market reached $200 million in 2024. Analysts project growth to $350 million by 2033. This expansion reflects rising demand across geotechnical surveys, infrastructure development, and mineral exploration.
1. How High-Density ERT Differs from Traditional Methods
Traditional DC resistivity sounding uses four electrodes per measurement. Field crews move electrodes manually between stations. This process is slow and labor-intensive.
High-density ERT deploys all electrodes at once. A multi-channel system controls electrode switching automatically. It collects thousands of data points in hours rather than days.
| Feature | Traditional DC Sounding | High-Density ERT |
|---|---|---|
| Electrode deployment | Manual, per station | Automated array |
| Data points per line | 10–50 | 500–2000+ |
| Survey speed | 1–2 days per km | 2–5 hours per km |
| Spatial resolution | 5–20 meters | 0.5–5 meters |
| Depth penetration | 100–500m | 50–300m typical |
| Cost per km | Lower equipment, higher labor | Higher equipment, lower labor |
High-density ERT reduces human error. It eliminates electrode positioning mistakes. The dense data coverage improves inversion stability and image quality.
2. Physical Principles
The method relies on Ohm’s Law and the conductive properties of earth materials. Current flows between two electrodes (A and B). Potential differences are measured between two other electrodes (M and N).
Apparent resistivity (ρs) calculates as:
ρs = K × ΔV / I
Where K is the geometric factor based on electrode spacing. ΔV is the measured potential difference. I is the injected current.
Different electrode configurations produce different current distributions. This allows depth and lateral resolution control through array selection.
Ⅱ. System Architecture and Technical Specifications
1. Power Module
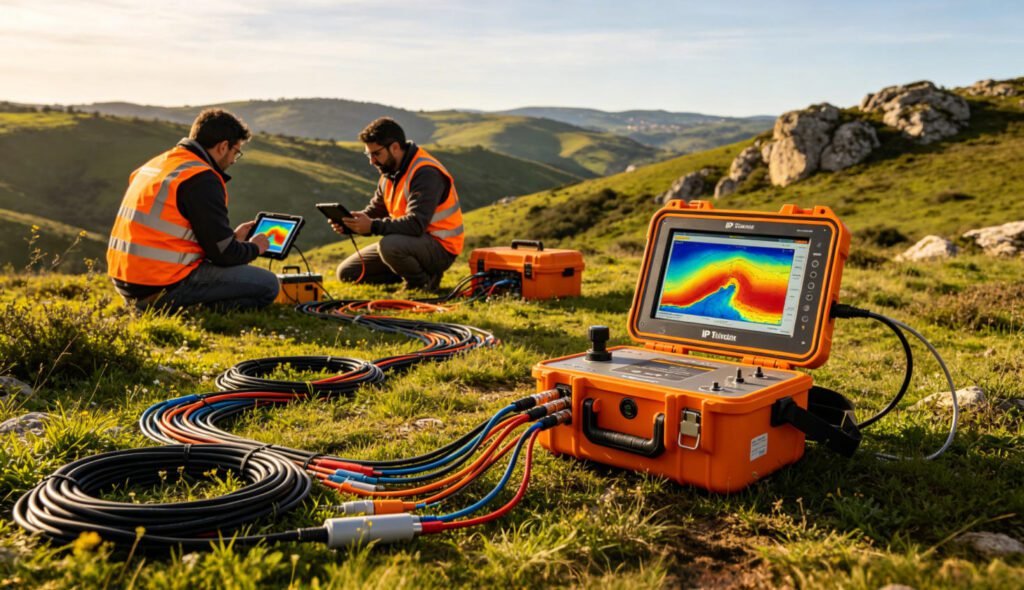
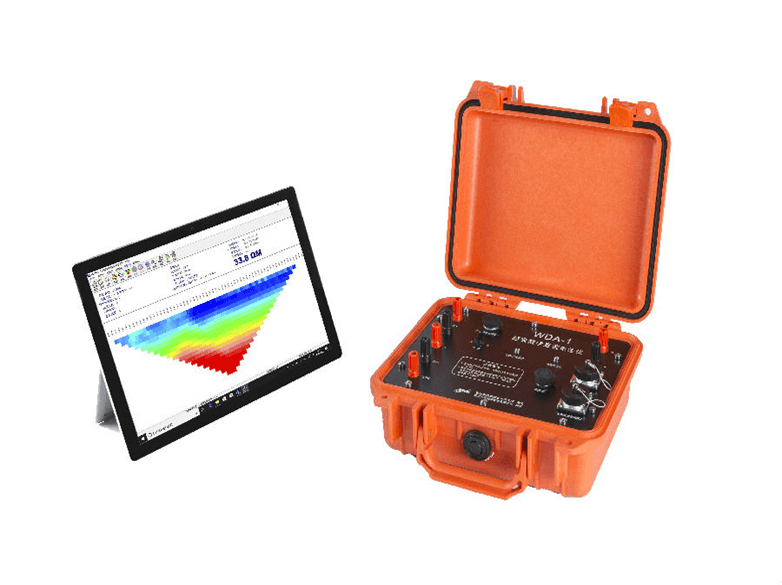
The WDA-1 Super Digital DC Resistivity/IP Meter serves as the core acquisition unit. Its transmitting specifications include:
- Maximum power: 9000W (1500V × 6A)
- Maximum voltage: ±1200V (2200V peak-to-peak)
- Maximum current: ±6A
- Pulse width: 1–60 seconds, duty ratio 1:1
This power level penetrates high-resistivity formations. It ensures stable signals in dry or rocky terrains. The adaptive output adjusts automatically based on ground conditions.
2. Receiving Unit
The receiving system captures microvolt-level signals:
| Parameter | Specification |
|---|---|
| Voltage range | ±32V (24-bit A/D) |
| Input impedance | >50MΩ |
| Voltage accuracy | ±0.2% (Vp≥5mV); ±1% (0.1mV≤Vp<5mV) |
| Current accuracy | ±0.2% (Ip≥5mA); ±1% (0.1mA≤Ip<5mA) |
| SP compensation | ±10V |
| 50Hz suppression | >80dB |
The 24-bit analog-to-digital converter preserves signal fidelity. High input impedance minimizes electrode contact resistance effects. The 80dB industrial frequency suppression eliminates power-line interference common near urban infrastructure.
3. Electrode Array and Switching
The system supports 120-channel synchronous control. It handles 18 electrode configurations:
Fixed arrays: Wenner, Schlumberger, dipole-dipole, pole-pole, pole-dipole
Rolling arrays: Wenner-Schlumberger, gradient, cross-diagonal
The WDZJ-4 multi-electrode switcher connects to the main unit. It routes current and potential connections automatically. Multi-electrode cables come in 5m or 10m spacing. Standard configurations support 60 or 120 electrodes.
4. Data Acquisition and Storage
| Parameter | Specification |
|---|---|
| Acquisition rate | 120 points/minute |
| Dynamic range | 120dB |
| Storage capacity | ≤1GB internal |
| Operating temperature | -20°C to +60°C |
| Bluetooth range | 10 meters wireless control |
Tablet PC software controls data collection. It displays real-time pseudosections during acquisition. This allows immediate quality control and survey adjustment in the field.
Ⅲ. Electrode Configurations and Array Selection
1. Wenner Array
The Wenner array uses equal spacing: AM = MN = NB = a.
Advantages:
- High signal-to-noise ratio
- Good vertical resolution
- Simple data interpretation
Disadvantages:
- Lower horizontal resolution
- Single-channel operation only
- Slower data collection
The Wenner array excels in layered earth investigations. It clearly resolves horizontal strata boundaries. It is the preferred array for groundwater and bedrock depth surveys.
2. Dipole-Dipole Array
The dipole-dipole array separates current and potential dipoles.
Advantages:
- High horizontal resolution
- Fast multi-channel acquisition
- Good lateral anomaly detection
Disadvantages:
- Lower signal-to-noise ratio
- Complex geometric factors
- Depth penetration decreases with n-factor
This array suits mineral exploration and fault detection. It maps steeply dipping structures better than Wenner configurations.
3. Schlumberger Array
The Schlumberger array uses asymmetric spacing with fixed potential electrodes.
Advantages:
- Variable depth sounding without moving M-N
- Good depth resolution
- Moderate signal strength
Disadvantages:
- Requires larger array for deep targets
- Sensitive to near-surface inhomogeneities
This array balances depth and resolution. It is common in engineering geological surveys.
4. Array Selection Decision Matrix
| Target Type | Recommended Array | Reason |
|---|---|---|
| Layered strata | Wenner | Best vertical resolution |
| Steep faults | Dipole-dipole | Best horizontal resolution |
| Deep bedrock | Schlumberger | Variable depth control |
| Shallow cavities | Pole-pole | Maximum coverage |
| 3D structures | Multiple arrays | Comprehensive sampling |
Explore Geotech’s electrical instrument catalog for array accessories
Ⅳ. Data Processing and Inversion Workflow
1. Preprocessing Steps
Raw data requires quality control before inversion:
- Bad data removal: Eliminate points with excessive noise or contact errors
- Topographic correction: Adjust electrode elevations for slope terrain
- Filter application: Remove cultural noise and power-line interference
- Apparent resistivity calculation: Convert raw V/I to ρs using geometric factors
The WDA-1 system performs many preprocessing steps automatically. Real-time filtering reduces post-processing time.
2. Inversion Algorithms
Inversion converts apparent resistivity data to true resistivity models. Common algorithms include:
Least-Squares Inversion: Minimizes data misfit through iterative model updates. Fast and stable for 2D data. Used in RES2DINV software.
Smoothness-Constrained Inversion: Penalizes rough models. Produces geologically realistic results. Preferred for environmental and engineering surveys.
Robust Inversion: Uses L1-norm minimization. Less sensitive to outliers. Better for noisy urban data.
Time-Lapse Inversion: Monitors resistivity changes over time. Essential for groundwater and remediation monitoring.
3. 2D vs 3D Imaging
2D imaging assumes structures extend perpendicular to the survey line. It works well for linear features like roads, dikes, and walls.
3D imaging requires multiple parallel lines or grid arrays. It resolves complex structures like cave systems, sinkhole clusters, and irregular ore bodies. Processing time increases significantly. A 3D survey may require 10× more data than an equivalent 2D survey.
Ⅴ. Engineering Case Study: Karst Detection in Guilin
1. Project Background
Karst terrain poses serious hazards to construction. Underground cavities cause sudden ground collapse. Water-filled caves trigger mud bursts during excavation. Geophysical detection identifies these risks before drilling.
This case study examines a highway foundation survey near Guilin, China. The area features typical karst limestone with extensive cave development.
Project parameters:
- Location: Guilin, Guangxi, China
- Geology: Devonian limestone with karst caves
- Survey goal: Detect cavities within 30m depth
- Array: Wenner configuration
- Electrode spacing: 5 meters
- Array length: 135 meters (27 electrodes)
2. Field Deployment
The crew deployed electrodes along a straight profile. They ensured electrode-ground contact resistance below 5kΩ. This required watering dry soil at some electrode positions.
The WDA-1 system acquired data automatically. One operator monitored the tablet PC. Another checked electrode connections. The entire 135m line completed in 3 hours.
Real-time pseudosections displayed during acquisition. Initial images showed resistivity variations from 50 to 1200 Ω·m.
3. Data Interpretation
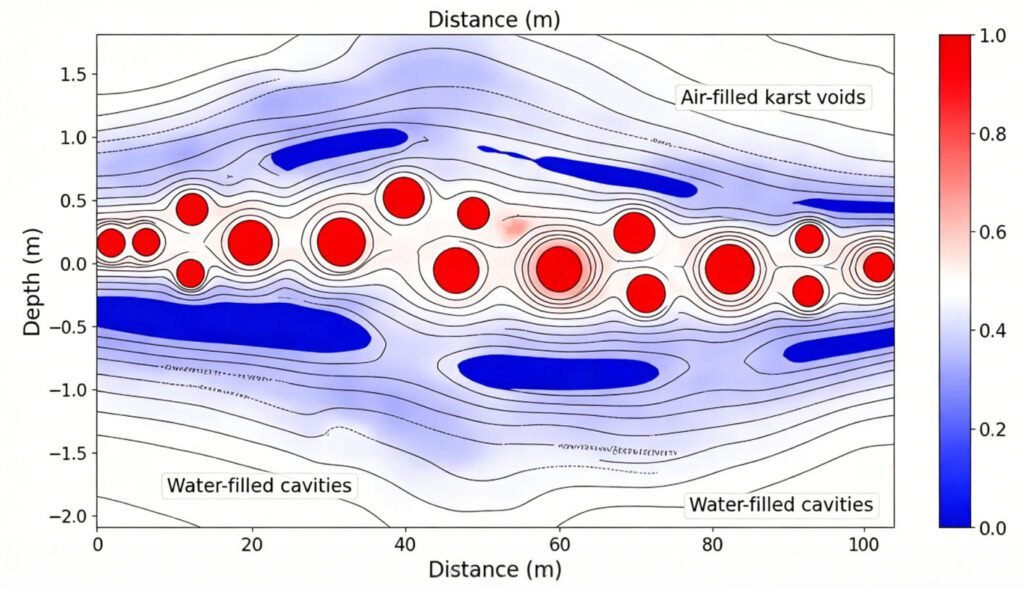
Inversion produced a 2D resistivity cross-section. Key findings included:
High-resistivity anomalies (>800 Ω·m):
- Interpreted as air-filled karst voids
- Three distinct anomalies identified
- Depths ranged from 8 to 22 meters
Low-resistivity zones (<150 Ω·m):
- Interpreted as water-filled cavities or clay-filled fissures
- Connected to surface drainage patterns
- Potential mud burst hazards during construction
Background resistivity (200–600 Ω·m):
- Competent limestone matrix
- Minor fracturing between anomalies
4. Validation Results
Drilling confirmed three cavities at predicted locations. Positional errors were less than 1.5 meters horizontally. Depth errors were less than 2 meters.
| Cavity | Predicted Depth | Drilled Depth | Horizontal Error |
|---|---|---|---|
| K1 | 12m | 13.2m | 0.8m |
| K2 | 18m | 17.1m | 1.2m |
| K3 | 22m | 21.5m | 1.4m |
This accuracy level saved significant drilling costs. It allowed targeted grouting rather than blanket treatment. The project completed on schedule with no karst-related incidents.
5. Comparison with Other Karst Detection Methods
| Method | Depth Range | Resolution | Cost | Best Application |
|---|---|---|---|---|
| High-density ERT | 5–100m | 0.5–5m | Medium | Shallow cavity mapping |
| GPR | 0–10m | 0.1–1m | Low | Very shallow voids |
| Seismic refraction | 5–50m | 2–10m | Medium | Bedrock mapping |
| Microgravity | 5–100m | 2–5m | High | Large void detection |
| Borehole camera | 0–depth of hole | Direct | High | Verification only |
High-density ERT offers the best balance for medium-depth karst surveys. It resolves both air-filled and water-filled cavities. It operates faster than microgravity and deeper than GPR.
Ⅵ. Operational Guidelines and Best Practices
1. Electrode Deployment
- Spacing selection: Use 2–5m for shallow targets (<30m). Use 10–20m for deep targets (>100m).
- Contact resistance: Keep below 5kΩ. Water electrodes if necessary.
- Linearity: Maintain straight lines within 0.5m tolerance.
- Avoid interference: Stay 10m away from buried pipes, cables, and metal fences.
2. Data Quality Control
- Real-time monitoring: Watch pseudosections during acquisition.
- Repeatability: Re-measure suspicious stations immediately.
- SP compensation: Apply ±10V self-potential correction for natural ground currents.
- Terrain correction: Input elevation data for slopes greater than 5 degrees.
3. Inversion Parameters
- Model mesh: Use finer meshes near the surface where resolution is highest.
- Regularization: Start with moderate smoothing. Reduce if geology is known to be complex.
- Convergence: Ensure RMS error drops below 10% before accepting results.
- Constraint: Incorporate borehole data when available for improved accuracy.
4. Safety Considerations
- High voltage: The 1500V output requires insulated cables and dry conditions.
- Lightning: Suspend operations during electrical storms.
- Traffic: Use warning signs and barriers on road surveys.
- Wildlife: Avoid disturbing sensitive habitats in protected areas.
View Geotech’s WDA-1 Super Digital DC Resistivity/IP Meter specifications
Ⅶ. Applications Beyond Karst Detection
1. Groundwater Exploration
High-density ERT locates aquifers and maps freshwater-saltwater interfaces. Low-resistivity zones (<100 Ω·m) typically indicate saturated zones. The method delineates aquifer thickness and extent for well placement.
2. Mineral Exploration
Sulfide ore bodies create low-resistivity anomalies. Graphite and clay alteration zones also appear conductive. High-density ERT works with induced polarization (IP) for mineral discrimination. The WDA-1 supports both resistivity and IP measurements.
3. Environmental Monitoring
Contaminant plumes alter ground resistivity. Organic pollutants often increase resistivity. Metallic contamination decreases resistivity. Time-lapse ERT tracks plume migration over months or years.
4. Landslide and Slope Stability
Slip zones contain clay and water. These materials show low resistivity. High-density ERT maps slip surface geometry. It monitors moisture changes that trigger slope failure. Studies show resistivity values of 100–150 Ω·m in active slip zones.
5. Urban Underground Investigation
City environments require careful array selection. Wenner arrays reduce cultural noise. Shallow surveys use 2m spacing to resolve utilities and foundations. 3D ERT creates volumetric models of complex urban geology.
Ⅷ. Future Trends in High-Density Resistivity
1. 3D Real-Time Imaging
New systems acquire and invert data simultaneously. Field teams view 3D resistivity volumes in real time. This enables adaptive survey design and immediate target confirmation.
2. Multi-Method Integration
Combined ERT and GPR surveys improve near-surface resolution. ERT provides depth; GPR provides detail. Joint inversion fuses both datasets into unified models.
3. AI-Assisted Interpretation
Machine learning algorithms classify geological anomalies automatically. They distinguish karst cavities from lithological variations. This reduces interpretation time and improves consistency.
4. Distributed Wireless Systems
Cable-free electrode nodes eliminate deployment constraints. Wireless synchronization enables irregular array geometries. This suits difficult terrain and rapid reconnaissance surveys.
Ⅸ. Conclusion
The high-density resistivity method delivers efficient, high-resolution subsurface imaging. Its automated electrode switching and dense data coverage outperform traditional DC sounding. The 6600W–9000W power output ensures reliable signals in challenging terrains.
Real-world case studies validate the method’s accuracy. The Guilin karst survey located three cavities with less than 1.5m positional error. This precision saves drilling costs and prevents construction hazards.
Proper array selection, careful field deployment, and appropriate inversion parameters maximize data quality. The method serves diverse applications from groundwater to mineral exploration, environmental monitoring to urban engineering.
Geotech Instrument provides complete high-density resistivity solutions. The WDA-1 main unit, WDZJ-4 switcher, and multi-electrode cables form integrated systems for professional geophysical surveys.
Contact Geotech for project-specific ERT configuration advice
Reference Sources
| Organization Name | Organization Type | Website | Citation Application Scenario |
|---|---|---|---|
| Society of Exploration Geophysicists (SEG) | International Professional Society | https://seg.org/ | Electrical resistivity method standards and ERT guidelines |
| U.S. Geological Survey (USGS) | Government Geological Survey Agency | https://www.usgs.gov/ | Karst hydrogeology and geophysical exploration guidelines |
| Environmental Protection Agency (EPA) | Government Environmental Agency | https://www.epa.gov/ | Groundwater contamination monitoring and ERT applications |
| European Association of Geoscientists & Engineers (EAGE) | European Geoscience Society | https://eage.org/ | Near-surface geophysics and engineering geology best practices |
| International Association of Hydrogeologists (IAH) | International Hydrogeology Association | https://iah.org/ | Groundwater exploration and aquifer characterization methods |
FAQ
What is the difference between high-density resistivity and traditional DC resistivity sounding?
A: High-density resistivity deploys all electrodes at once and uses automated switching. It collects 500–2000+ data points per line in hours. Traditional DC sounding moves four electrodes manually between stations. It collects 10–50 points per line in 1–2 days. High-density ERT offers higher resolution and faster acquisition but requires more expensive equipment.
How deep can high-density ERT detect karst cavities?
A: Detection depth depends on electrode spacing and ground resistivity. With 5m spacing, typical depth reaches 30–50m. With 10m spacing, depth extends to 100m. The WDA-1’s 9000W power output improves signal penetration in high-resistivity limestone. Air-filled cavities appear as high-resistivity anomalies (>800 Ω·m). Water-filled cavities show low resistivity (<150 Ω·m).
Which electrode array is best for karst detection?
A: The Wenner array works best for shallow layered karst. It provides high signal-to-noise ratio and clear vertical resolution. The dipole-dipole array suits steeply dipping fracture zones. It offers better horizontal resolution. For comprehensive 3D karst mapping, combine multiple arrays or use 3D ERT with grid electrode deployment.
What is the accuracy of high-density ERT for cavity location?
A: Field case studies show horizontal positional errors of 0.8–1.5m and depth errors of 1–2m for cavities at 10–25m depth. Accuracy depends on electrode spacing, data density, and inversion parameters. Incorporating borehole constraints improves accuracy further. The Guilin case study validated three cavities with errors under 1.5m.
Can high-density ERT distinguish between air-filled and water-filled cavities?
A: Yes. Air-filled cavities show high resistivity (>800 Ω·m) because air is an electrical insulator. Water-filled cavities show low resistivity (<150 Ω·m) because water conducts electricity. Clay-filled fissures also appear as low-resistivity zones. IP measurements can help distinguish clay from water based on chargeability differences.