Welcome to Geotech!
Electrical Resistivity Tomography: A Complete Technical Guide
TIPS:Electrical Resistivity Tomography (ERT) is a non-invasive geophysical technique that maps subsurface resistivity by injecting direct current through electrode arrays. This technical guide explains how an ERT System works—from Ohm’s Law fundamentals and electrode configurations to 2D/3D data inversion—helping geophysicists understand resistivity distribution for groundwater, mineral, and engineering projects.

Ⅰ. What Is Electrical Resistivity Tomography?
Geophysical surveys often face a critical challenge. Drilling is expensive and provides only point data. Surface geophysics fills this gap. Electrical Resistivity Tomography (ERT) stands out as the most versatile shallow-imaging tool.
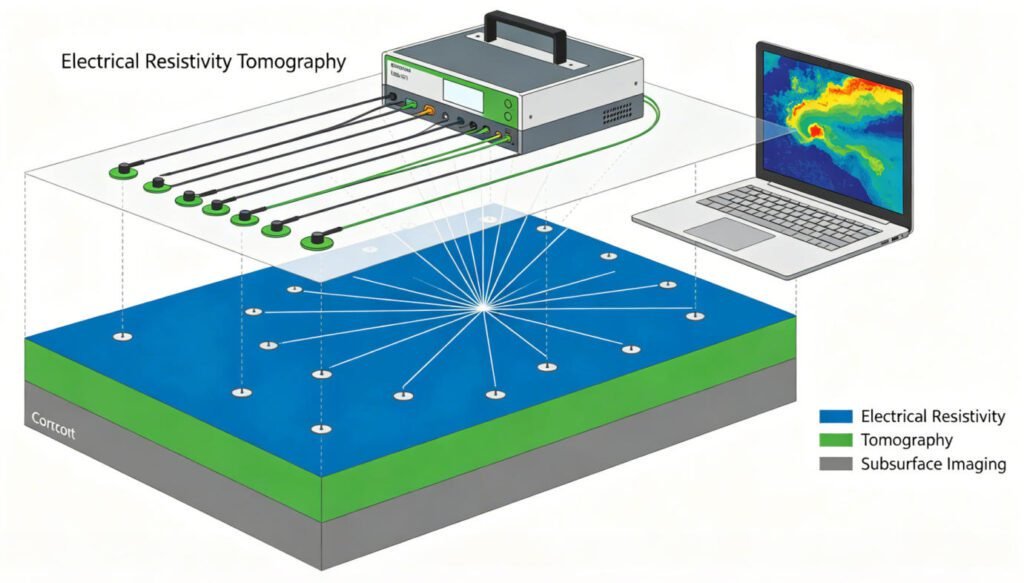
ERT measures how strongly subsurface materials resist electric current. It creates 2D or 3D images of resistivity distribution. These images reveal geology, hydrology, and contamination without excavation. Modern ERT System hardware collects thousands of measurements automatically. A multi-electrode cable with 48 to 120 take-outs spans the survey line. The resistivity meter switches current and potential electrode pairs in seconds.
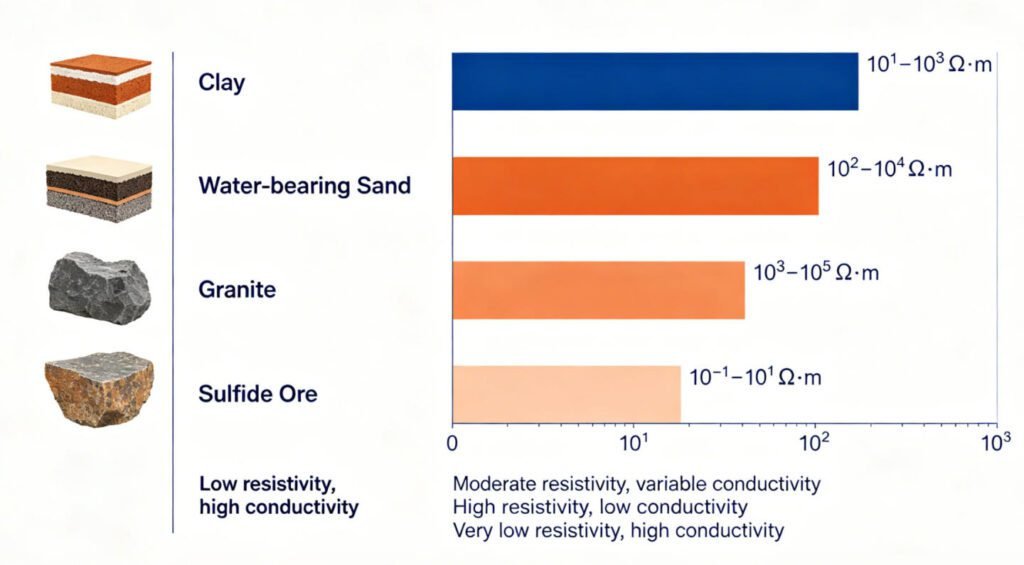
Resistivity values range from less than 1 Ω·m for saline water to over 10,000 Ω·m for dry granite. This broad dynamic range makes ERT applicable across diverse environments. Clay, water, ore minerals, and bedrock each display unique signatures.
Ⅱ. The Physics Behind ERT
1. Ohm’s Law and Apparent Resistivity
ERT relies on a simple physical law. Current flows between two electrodes (A and B). The system measures voltage at two other electrodes (M and N). Apparent resistivity is calculated using the geometric factor K:
ρs = K × (ΔV / I)
K depends only on electrode spacing. This formula works for uniform ground. Real geology is layered and heterogeneous. Apparent resistivity blends contributions from all materials in the current path. Inversion software later separates these mixed signals into true resistivity values.
2. Factors Controlling Rock Resistivity
Several properties govern how rocks conduct electricity. Pore fluid chemistry dominates in most sedimentary environments. Saline water lowers resistivity dramatically. Fresh water raises it. Clay minerals and metallic sulfides conduct current through their crystal structures. This makes them special cases.
Porosity and saturation also matter. Dry sand has high resistivity. The same sand saturated with fresh water drops to 100–500 Ω·m. Fractured bedrock shows lower values than intact rock. Weathering, faulting, and organic contamination all alter resistivity signatures.
| Material | Typical Resistivity (Ω·m) | Geological Meaning |
|---|---|---|
| Clay / Silt | 1 – 50 | Low-porosity or saturated fine grains |
| Sand (fresh water) | 50 – 500 | Aquifer material |
| Sand (saline water) | < 10 | Saltwater intrusion |
| Granite (fresh) | 1,000 – 10,000 | Intact bedrock |
| Ore minerals | 0.1 – 10 | Metallic sulfides |
Ⅲ. ERT System Hardware Components
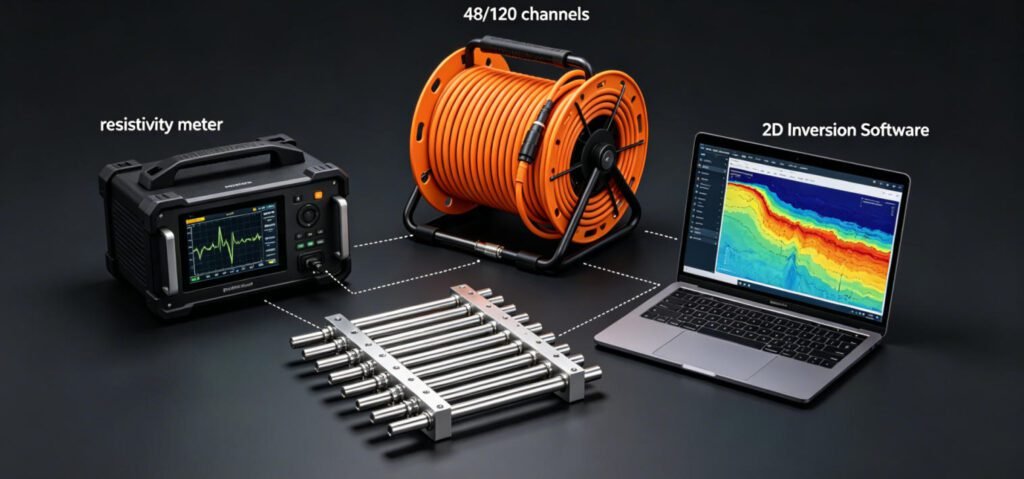
1. Resistivity Meter
The meter is the system brain. It generates stable direct current and records microvolt-level potentials. Modern units output 1–2A maximum current. Input impedance exceeds 10 MΩ to avoid loading effects. The Geotechcn ERT System includes automatic gain ranging. This prevents signal saturation in conductive clays.
2. Multi-Electrode Cable
Cables contain 24 to 120 electrode take-outs. Spacing ranges from 1 to 10 meters. The cable connects to a switching unit. The unit selects active electrode pairs automatically. Waterproof connectors and ruggedized conductors withstand tropical rain and desert dust.
3. Electrodes
Stainless steel stakes provide durable ground contact. Standard length is 30–60 cm. In rocky terrain, longer electrodes or conductive gel improve contact. Poor grounding is the leading cause of data noise.
4. Inversion Software
Software converts apparent resistivity into true geological models. It uses least-squares or smoothness-constrained algorithms. The output is a color-coded cross-section. Blue zones show conductive material. Red zones indicate resistive rock.
Ⅳ. Survey Configurations and Data Collection
1. Electrode Arrays
ERT uses several standard geometries. Each array trades resolution against depth and signal strength.
Wenner Array: All electrodes are equally spaced. It offers excellent vertical resolution and strong signals. Best for layered geology like sedimentary basins.
Schlumberger Array: Potential electrodes remain close together. Current electrodes spread wider. This array penetrates deeper while maintaining good resolution. Preferred for groundwater aquifer mapping.
Dipole-Dipole Array: Electrode pairs are separated. This array detects steep structures like faults and dykes. Signal strength drops with depth, so it suits shallow targets.
2. 2D vs 3D Surveys
2D surveys use a single cable line. They produce a vertical cross-section beneath the profile. This covers most engineering and groundwater projects.
3D surveys require multiple parallel lines or grid arrays. They create volumetric resistivity models. 3D Electrical Resistivity Tomography is essential for complex ore bodies, cave systems, and contaminant plumes. Data volume increases tenfold. Processing time extends from hours to days.
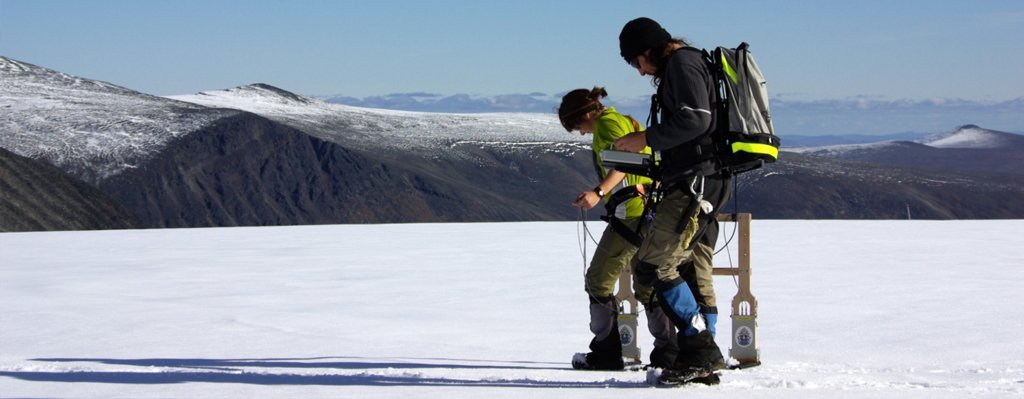
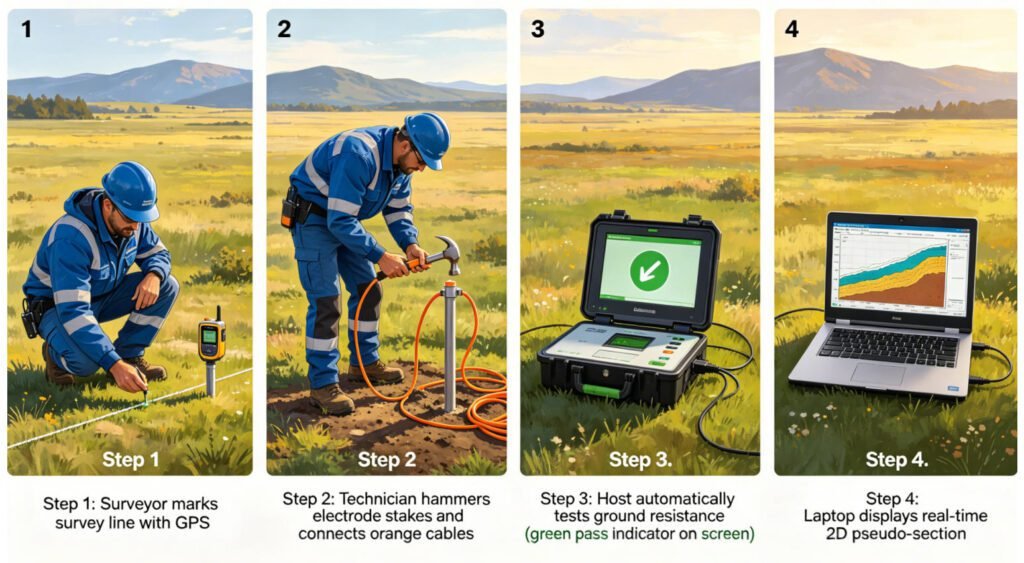
3. Field Workflow
A standard 2D survey follows four steps. First, mark electrode positions with GPS. Second, hammer electrodes and connect cables. Third, check contact resistance with the ERT System diagnostic tool. Fourth, run automated acquisition. A 48-channel survey with 2-meter spacing collects 900+ data points in 30–60 minutes.
Ⅴ. Applications of Electrical Resistivity Tomography
1. Groundwater Exploration
ERT maps aquifers and water table depth. Freshwater zones show moderate resistivity. Contaminated or saline water drops below 5 Ω·m. Clay layers act as aquitards with very low values. In arid regions, ERT identifies drilling targets without expensive dry holes.
2. Mineral Exploration
Disseminated sulfide ores create low-resistivity anomalies. When combined with Induced Polarization (IP), ERT distinguishes ore from barren conductive zones. The Geotechcn ERT System supports IP data acquisition. This dual-function capability reduces field mobilization costs.
3. Engineering and Environmental
Engineers use ERT to detect subsurface voids, evaluate dam integrity, and monitor landslides. Long-term monitoring systems track seasonal saturation changes. For contaminated sites, ERT maps pollutant plumes and landfill boundaries.
4. Geothermal and Oilfield
ERT identifies fracture networks and thermal fluid pathways. In oilfields, time-lapse surveys track water flooding fronts. The global geophysical equipment market is growing rapidly. Mining, water, and energy sectors drive demand for reliable ERT System solutions.
Ⅵ. Advantages and Limitations
1. Key Strengths
ERT is non-invasive. It requires no drilling or excavation. Data density is high. Modern systems collect thousands of points per day. The method resolves lateral variations better than Vertical Electrical Sounding (VES). 3D capability provides volumetric imaging for complex geology.
2. Practical Limitations
ERT needs galvanic contact. Rocky or paved surfaces prevent electrode insertion. Depth is limited by array length. Typical maximum penetration is one-third to one-fifth of the total spread. Cultural noise from power lines and pipes can distort data. Advanced processing or alternative arrays often resolve these issues.
| Aspect | ERT Capability | Typical Limit |
|---|---|---|
| Depth | 10 – 200 m | Array length / 5 |
| Resolution | 0.5 – 5 m | Electrode spacing / 2 |
| Speed | 1–2 km/day | Terrain dependent |
| Surface | Soil, grass | Asphalt, rock (difficult) |
Ⅶ. Conclusion
Electrical Resistivity Tomography is a foundational geophysical method. It delivers high-resolution subsurface images for groundwater, mineral, and engineering projects. An ERT System combines field-hardened hardware with powerful inversion software. Understanding electrode arrays, resistivity principles, and application limits ensures reliable survey design.
Geotechcn provides scalable Electrical Resistivity Tomography solutions from 48-channel portable units to 120-channel 3D systems. Our equipment serves projects across Southeast Asia, Africa, the Middle East, and South America. Learn more professional geophysical solutions at www.geotechcn.net.
Reference
| Reference Content | Source URL |
|---|---|
| ERT Technical Overview (IntechOpen) | https://www.intechopen.com/chapters/64562 |
| ERT Applications in Groundwater Exploration | https://link.springer.com/article/10.1007/s43832-026-00362-x |
| Resistivity Meter Market Trends | https://www.lucintel.com/resistivity-meter-market.aspx |
| ERT Applications at Archaeological Sites | https://www.mdpi.com/2072-4292/16/3/519 |
| ERT Principles and Electrode Configurations | https://www.frontiersin.org/journals/water/articles/10. |
FAQ
What does electrical resistivity tomography measure?
Electrical Resistivity Tomography measures the electrical resistance of subsurface materials. It maps how difficult it is for electric current to pass through rocks, soils, and fluids. The resulting images show geological layers, water content, and contamination zones.
How does electrical resistivity tomography work?
An ERT System injects direct current through two electrodes. It measures voltage at two other electrodes. The instrument calculates apparent resistivity using Ohm’s Law. Inversion software converts thousands of measurements into a 2D or 3D geological model.
Is electrical resistivity tomography the only electrical method?
No. ERT is part of the DC resistivity family. Vertical Electrical Sounding (VES) measures at a single point with varying spacing. Induced Polarization (IP) adds chargeability data. Electromagnetic (EM) methods use induction instead of direct contact.
How is ERT data collected?
Field crews deploy electrodes along a survey line. A multi-core cable connects them to the ERT System. The switching unit cycles through electrode combinations automatically. A 48-channel survey collects 900+ data points in 30–60 minutes.
What is the difference between 2D and 3D ERT?
2D surveys use one electrode line to create a vertical cross-section. 3D surveys use multiple parallel lines or grids to build a volume model. 3D Electrical Resistivity Tomography resolves complex geology but requires more time and processing power.