Welcome to Geotech!
Archaeological Magnetic Survey: New Applications of 3D Modeling Technology
TIPS:3D Magnetic Survey Mapping is revolutionizing how archaeologists visualize buried heritage sites without excavation. By integrating proton magnetometer data with advanced volumetric rendering techniques, researchers can now create immersive three-dimensional reconstructions of ancient settlements. This comprehensive guide explores how 3D magnetic survey mapping transforms raw geomagnetic data into actionable archaeological insights using proton magnetometer technology and high-sensitivity detection systems.

Ⅰ. The Evolution from 2D to 3D in Archaeological Magnetometry
1.Limitations of Traditional Magnetic Surveys
Archaeological magnetic surveys have served the field for decades. These methods detect subsurface features by measuring variations in Earth’s magnetic field. Burned structures, hearths, and ferrous objects create measurable anomalies.
However, traditional 2D mapping presents significant constraints. Flat grayscale plots struggle to convey depth information. Complex overlapping features become difficult to interpret. Researchers often miss subtle stratigraphic relationships.
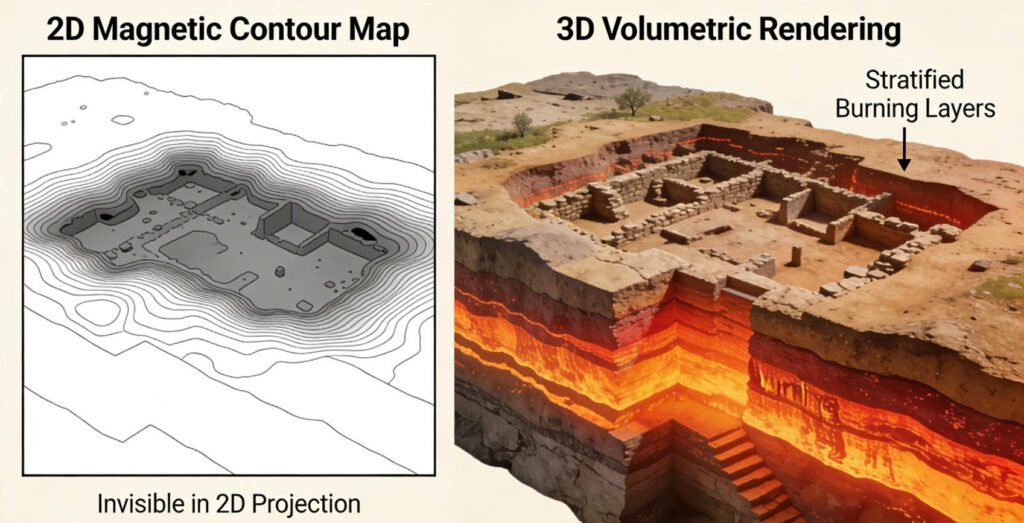
Figure1:Comparison between conventional 2D magnetic contour map and modern 3D volumetric rendering showing an Iron Age settlement. The 3D model reveals stratified burning layers invisible in 2D projection.
2.The Technical Leap to Volumetric Imaging
3D magnetic survey mapping overcomes these limitations through computational modeling. Modern processing algorithms transform discrete data points into continuous volumetric representations.
The workflow involves three stages:
- Data acquisition using high-sensitivity magnetometers
- Gridding and interpolation of magnetic field values
- Volumetric rendering with depth slicing capabilities
This approach preserves subtle amplitude variations. Researchers can rotate models freely. They can isolate specific depth ranges. They can detect weak anomalies masked by stronger nearby signals.
Ⅱ. Proton Magnetometer Technology: The Foundation of Precision
1.Why Proton Precession Dominates Archaeological Applications
Proton magnetometers remain the preferred choice for archaeological surveys. These instruments exploit the magnetic moment of hydrogen nuclei in hydrocarbon fluids.
When a polarizing field aligns proton spins, subsequent precession around Earth’s field generates a measurable signal. The Larmor frequency directly correlates with field strength. This principle enables absolute magnetic measurements with exceptional stability.
Key advantages include:
- Orientation independence: Sensor direction doesn’t affect readings
- Wide dynamic range: Effective from 20,000 to 120,000 nT
- Long-term stability: Minimal drift over extended surveys
- Cost-effectiveness: Lower maintenance than optically pumped alternatives
2.OCXO Stabilization: Enhancing Data Quality
Modern proton magnetometers incorporate Oven-Controlled Crystal Oscillator (OCXO) technology. This temperature-compensated frequency reference reduces measurement jitter to ±0.1 nT.
For archaeological applications, this precision matters intensely. Weak magnetic contrasts between mudbrick walls and surrounding soil require sensitive detection. Faint thermoremanent signals from ancient hearths demand stable baselines.
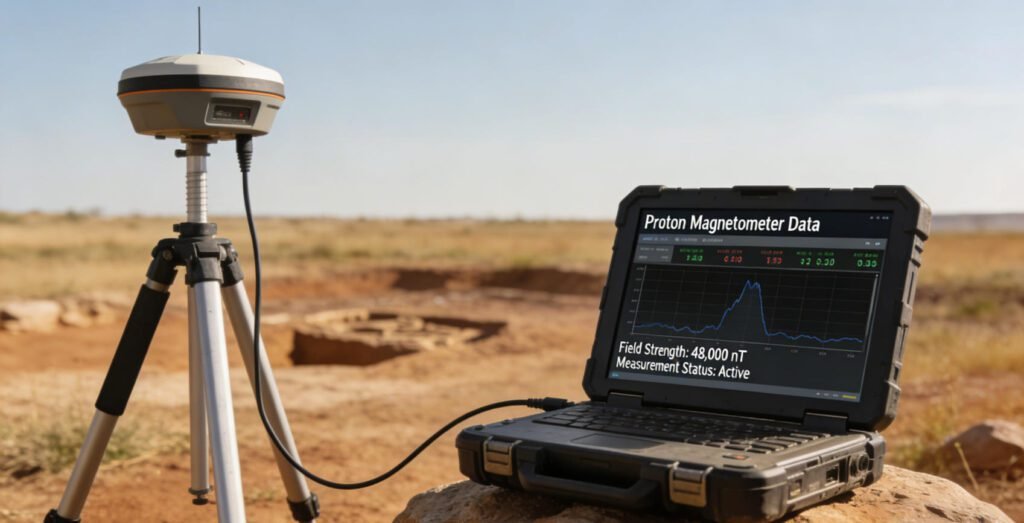
Figure2:Field operation of OCXO-stabilized proton magnetometer during archaeological survey, showing sensor deployment and real-time data acquisition on ruggedized field computer.
Ⅲ. Building 3D Magnetic Models: Technical Workflows
1.Data Acquisition Strategies
Effective 3D magnetic survey mapping requires systematic data collection. Surveyors typically employ one-meter line spacing with half-meter station intervals. This density ensures adequate spatial sampling for volumetric reconstruction.
Critical parameters include:
- Sensor height consistency (usually 0.3-0.5m above ground)
- Grid alignment with expected feature orientations
- Diurnal variation monitoring via base station
- GPS synchronization for precise positioning
2.Processing Methodologies
Raw magnetic data requires several processing stages before 3D magnetic survey mapping:
Noise reduction: High-pass filtering removes regional gradients. Diurnal corrections subtract temporal field variations.
Gridding interpolation: Kriging algorithms generate regular data matrices from irregular survey points. This method accounts for data clustering and provides optimal unbiased estimates.
Depth slicing: The processed grid undergoes upward continuation calculations. These mathematical transformations simulate measurements at different elevations. The resulting depth slices reveal how magnetic sources distribute vertically.
3.Volumetric Visualization Techniques
Advanced software platforms combine depth slices into coherent 3D volumes. Isosurface rendering creates solid models from specific magnetic amplitude thresholds. Volume rendering applies color gradients to represent field strength continuously.
These visualizations enable virtual excavation. Researchers can digitally “remove” overburden layers. They can examine internal feature geometries. They can measure dimensions and orientations with millimeter precision.
Ⅳ. Applications in Archaeological Contexts
1.Settlement Pattern Analysis
At complex archaeological sites, 3D magnetic survey mapping distinguishes multiple occupation phases. Vertical stratification becomes visually apparent in volumetric models.
A Bronze Age case study demonstrates this capability. Surface magnetic data appeared chaotic—multiple overlapping anomalies created confusing 2D plots. However, 3D processing isolated distinct horizontal layers. The deepest layer revealed a circular ditch system. Intermediate levels showed rectangular house foundations. Uppermost strata contained industrial debris from later metalworking activities.
2.Monument Detection and Characterization
Large ceremonial structures produce distinctive magnetic signatures. Proton magnetometers detect fired clay construction materials. They map magnetic contrasts between stone architecture and surrounding sediments.
Three-dimensional modeling helps interpret these complex signatures. Buried megalithic alignments appear as linear anomaly chains. Subterranean chambers create distinct magnetic lows. Encircling ditches produce characteristic dipole patterns.
3.Intra-Site Feature Mapping
Within established sites, high-resolution archaeological magnetic imaging locates specific targets. Kilns and hearths generate strong thermoremanent magnetization. Storage pits show magnetic susceptibility contrasts from enriched organic content.
Fine-scale 3D visualization identifies these features against background noise. Small-scale structures—such as individual postholes or burial cists—become detectable through careful data processing.
Ⅴ. Integration with Complementary Technologies
1.Multi-Sensor Data Fusion
3D magnetic survey mapping achieves maximum effectiveness when combined with other geophysical methods. Ground-penetrating radar provides complementary dielectric information. Electrical resistivity mapping reveals moisture contrasts invisible to magnetometers.
Data fusion techniques overlay these datasets in unified 3D environments. Magnetic anomalies gain contextual interpretation. False positives decrease through cross-validation. Comprehensive site models emerge from multiple physical properties.
2.Drone-Based Magnetic Acquisition
Recent developments enable aerial magnetic surveys using unmanned platforms. Lightweight high-sensitivity magnetometers mounted on drones cover large areas rapidly. While altitude reduces spatial resolution, this approach efficiently identifies survey priorities.
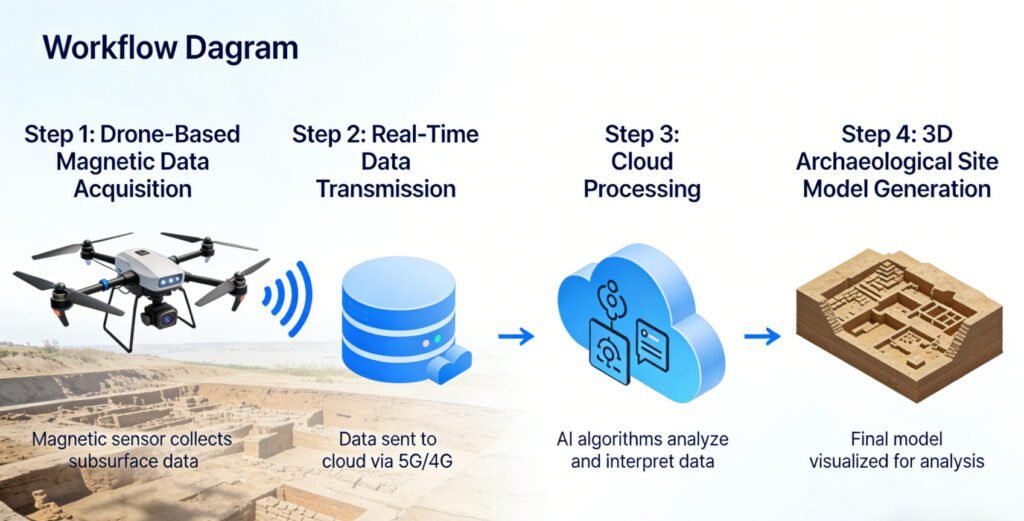
Figure3:Workflow diagram showing drone-based magnetic data acquisition, real-time transmission, cloud processing, and final 3D archaeological site model generation.
Ⅵ. Practical Implementation Guidelines
1.Equipment Selection Criteria
Choosing appropriate geomagnetic survey equipment depends on specific archaeological objectives:
For reconnaissance surveys: Single-sensor proton magnetometers offer portability and efficiency. The JPMG-series instruments provide 0.05 nT sensitivity with GPS integration.
For detailed mapping: Gradiometer configurations using paired sensors eliminate diurnal noise. These setups excel at detecting shallow, subtle features.
For large-area coverage: Multi-sensor arrays mounted on carts enable rapid data collection. Parallel sensor configurations maximize survey efficiency.
2.Field Methodology Best Practices
Successful archaeological magnetic imaging requires meticulous field procedures:
- Establish base stations upwind from archaeological features
- Maintain consistent walking speed to ensure uniform data density
- Perform daily instrument calibration checks
- Document surface conditions that might affect magnetic readings
- Archive raw data before any processing interventions
3.Data Interpretation Frameworks
Interpreting 3D magnetic survey mapping results demands archaeological expertise. Not all anomalies indicate cultural features. Geological variations, modern disturbances, and agricultural activity create magnetic responses.
Systematic interpretation follows hierarchical analysis:
- Identify anomaly patterns and spatial associations
- Compare with known archaeological signatures
- Assess geological context and formation processes
- Prioritize targets for ground-truthing excavations
- Refine models based on excavation feedback
Ⅶ. Future Directions in Magnetic Archaeological Prospection
Emerging technologies promise enhanced capabilities for archaeological survey equipment. Quantum magnetometers using atomic vapor cells achieve femtotesla sensitivity. These instruments may detect previously invisible features.
Real-time 3D visualization during data collection enables adaptive survey strategies. Immediate feedback allows on-site decision making. Surveyors can focus on promising areas without returning to base for processing.
Artificial intelligence applications automate anomaly detection and classification. Machine learning algorithms trained on verified archaeological datasets identify subtle patterns human interpreters might overlook.
The convergence of high-sensitivity magnetometers, advanced computing, and immersive visualization continues transforming archaeological exploration. Non-invasive investigation preserves fragile heritage while maximizing information recovery.
Reference
- WIKI:https://en.wikipedia.org/wiki/Electrical_resistivity_tomography
- Society of Exploration Geophysicists (SEG) https://seg.org/
- Society of Environmental and Engineering Geophysicists (EEGS) https://www.eegs.org/
- Geology and Equipment Branch of China Mining Association http://www.chinamining.org.cn/
- International Union of Geological Sciences (IUGS) http://www.iugs.org/
- European Geological Survey Union (Eurogeosurveys) https://www.eurogeosurveys.org/
