Welcome to Geotech!
What Is Electrical Resistivity Tomography? A Complete Guide for Beginners
TIPS:Electrical Resistivity Tomography (ERT) is a powerful geophysical imaging technique that maps subsurface structures by measuring electrical resistance. This guide explains how an ERT System operates, from current injection to 2D/3D visualization, helping beginners understand Electrical Resistivity Tomography fundamentals and real-world applications in mineral exploration, groundwater detection, and civil engineering.

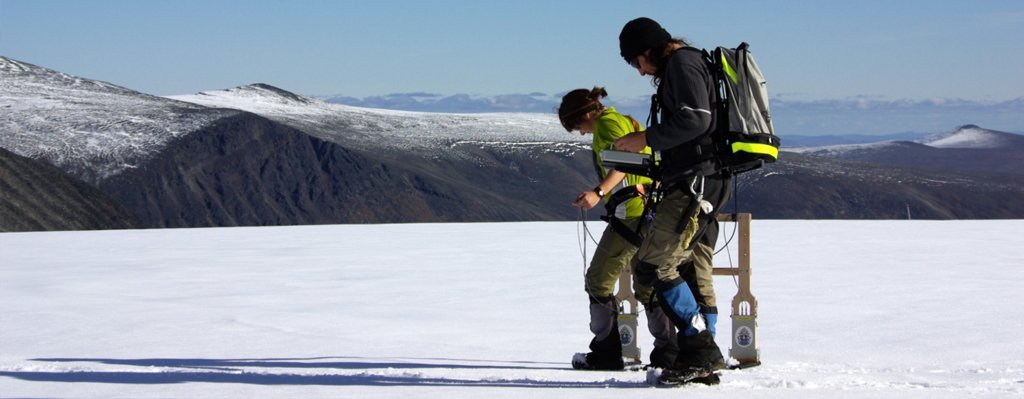
Starting a geophysical project often feels overwhelming when you face dozens of survey methods and complex terminology. Many beginners struggle to understand Electrical Resistivity Tomography and how to apply it effectively in the field. This guide breaks down the basics of Electrical Resistivity Tomography, helping you grasp its working principle and practical application scenarios easily. Whether you need groundwater mapping or mineral exploration, an ERT System offers a reliable, non-invasive solution that delivers clear subsurface images without drilling.
How Does an ERT System Work?
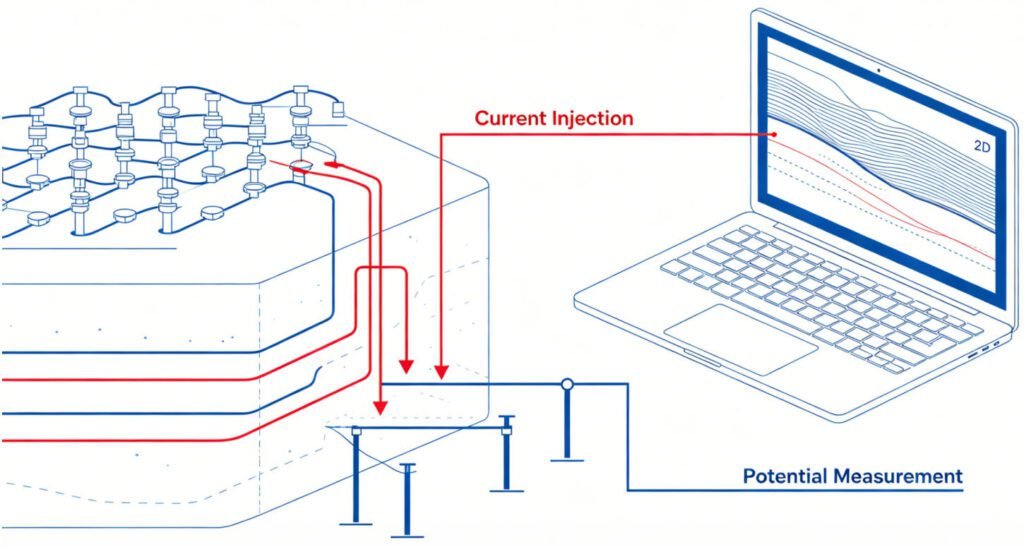
An ERT System operates on a simple yet elegant principle. It injects direct current into the ground through a pair of electrodes. Then it measures the resulting voltage difference at other electrode pairs. The instrument records apparent resistivity values along a survey line. Modern systems use multi-electrode cables with 48 to 120 take-outs. This setup enables rapid 2D profiling without moving electrodes manually.
The collected data travels to inversion software. Algorithms convert raw measurements into true resistivity models. The final output shows a cross-sectional image of subsurface layers. Different materials display distinct resistivity signatures. Clay-rich zones appear as low-resistivity areas. Bedrock and dry sand show high resistivity values. This contrast makes geological interpretation straightforward for field engineers.
Key Components of a Modern ERT System
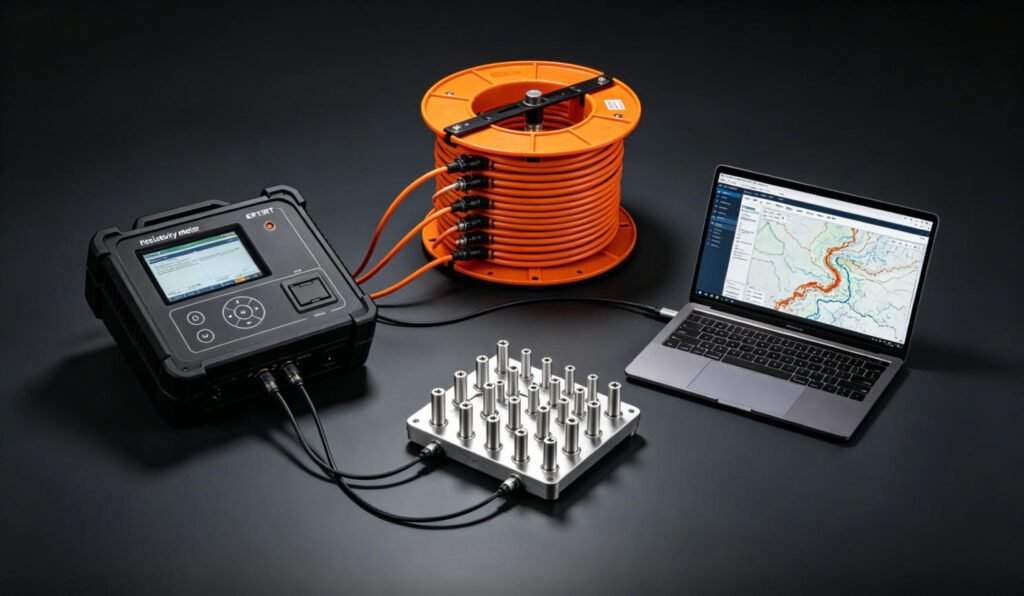
A field-ready ERT System consists of four essential parts. Understanding each component helps you evaluate equipment quality and match hardware to project needs.
Resistivity Meter (The Brain)
The resistivity meter controls current output and voltage recording. Key specs include maximum current (typically 1-2A), input impedance (should exceed 10 MΩ), and measurement resolution (microvolt level). High-quality meters from Geotechcn offer automatic gain ranging. This feature prevents signal saturation in conductive environments like clay-rich soils.
Multi-Electrode Cable Array
Cable spacing determines lateral resolution. Standard spacings range from 1 to 10 meters. For shallow engineering surveys, 2-meter spacing works well. Deep mineral exploration may require 10-meter spacing with roll-along techniques. Geotechcn provides rugged, waterproof cables rated for tropical and desert conditions.
Switching Unit
The switching unit automatically selects active electrode pairs. Modern units support full-waveform recording. This capability stores complete voltage decay curves. You can later analyze induced polarization (IP) effects from the same dataset.
Inversion Software
Software transforms raw data into geological models. Look for packages offering least-squares inversion, time-lapse comparison, and 3D visualization. Geotechcn systems include user-friendly interpretation tools. These tools help geophysicists generate client-ready reports within hours.
Where Is Electrical Resistivity Tomography Used?
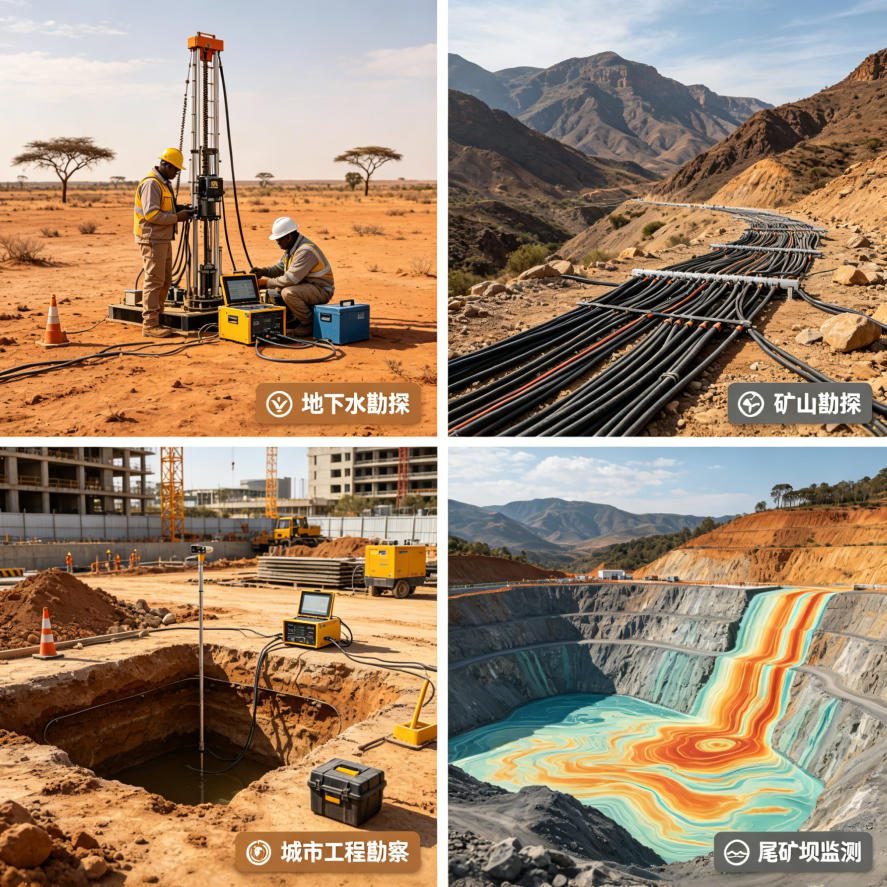
Electrical Resistivity Tomography serves diverse industries. Its non-destructive nature and cost efficiency make it indispensable for preliminary site investigation.
Groundwater Exploration
ERT excels at locating aquifers and mapping water table depth. Freshwater-saturated zones show resistivity between 10-100 Ω·m. Contaminated or saline water drops below 5 Ω·m. A 2026 study in Chad used 3D Electrical Resistivity Tomography to map groundwater reserves in the Abéché Basin, demonstrating the method’s reliability in arid regions.
Mineral Exploration
Sulfide ore bodies create sharp resistivity contrasts. Disseminated mineralization often correlates with low-resistivity anomalies. IP-resistivity combined surveys improve target discrimination. The ERT System from Geotechcn supports time-domain IP acquisition. This dual-function capability reduces field mobilization costs.
Civil Engineering & Environmental Monitoring
Engineers use ERT to detect subsurface voids, evaluate dam integrity, and monitor landslide zones. Long-term ERT monitoring systems installed on critical slopes can define attention thresholds for water content changes. This helps authorities mitigate hydrogeological risks triggered by extreme rainfall.
Geothermal & Oilfield Applications
Electrical Resistivity Tomography identifies fracture networks and thermal fluid pathways. In oilfield contexts, time-lapse ERT tracks water flooding fronts. The global resistivity meter market is projected to reach $2.2 billion by 2030, driven by mining, water exploration, and geotechnical applications.
Choosing Your First ERT System: A Practical Checklist
Selecting the right ERT System requires balancing technical specs with budget constraints. Here is a field-proven checklist.
| Consideration | Beginner-Friendly Spec | Professional Spec |
|---|---|---|
| Channels | 48 | 120+ |
| Max Current | 1A | 2A+ |
| IP Function | Optional | Integrated |
| Software | Basic 2D | 2D/3D + Time-lapse |
| Weight | <15 kg portable | Stationary + portable |
| Price Range | $8,000-$15,000 | $20,000-$40,000 |
For teams starting out, a 48-channel portable ERT System covers most shallow applications. Geotechcn offers scalable configurations. You can upgrade channel count later without replacing the core controller.
Why Geotechcn for Your ERT Investment?
Geotechcn designs Electrical Resistivity Tomography solutions with field realities in mind. Our ERT System lineup covers 48 to 120 channels. All units feature IP-ready hardware and ruggedized cables for harsh environments.
Key advantages include competitive pricing compared to European brands, localized technical support with 24-hour response commitment, and intuitive software that reduces training time. Our equipment serves projects across Southeast Asia, Africa, the Middle East, and South America. We understand tropical moisture, desert dust, and high-altitude logistics.
This guide covered the fundamentals of Electrical Resistivity Tomography, from current injection principles to real-world groundwater and mineral applications. An ERT System delivers cost-effective subsurface imaging without destructive drilling. If you need a reliable Electrical Resistivity Tomography solution tailored to your project, Geotechcn provides high-performance equipment with expert support. Learn more professional geophysical solutions at www.geotechcn.net.
FAQS
What does electrical resistivity tomography measure?
Electrical Resistivity Tomography measures the electrical resistance of subsurface materials. It maps how strongly different geological layers oppose electric current flow. This data reveals rock types, moisture content, fracture zones, and contaminant plumes without excavation.
How does electrical resistivity tomography work?
An ERT System injects direct current into the ground through electrodes. It records voltage differences at other electrodes. Inversion software converts these measurements into 2D or 3D resistivity models. High-resistivity zones typically indicate bedrock or dry sand. Low-resistivity zones suggest clay, water, or mineralization.
Is electrical resistivity tomography the only electrical method?
No. ERT belongs to the DC resistivity family. Related techniques include Vertical Electrical Sounding (VES), which measures at a single point, and Induced Polarization (IP), which adds chargeability data. Electrical Resistivity Tomography offers superior lateral coverage compared to these alternatives.
How is ERT data collected?
Field crews deploy a linear electrode array along the survey line. The ERT System automatically cycles through electrode combinations. A standard 48-channel survey with 2-meter spacing takes 30-60 minutes. Data quality depends on electrode contact resistance and ambient electrical noise levels.
What is the difference between 2D and 3D ERT surveys?
2D surveys use a single electrode line to create a vertical cross-section. 3D surveys require multiple parallel lines or grid arrays. 3D Electrical Resistivity Tomography provides volume visualization but demands more field time and processing power. Most beginner projects start with 2D profiling.
Reference
- Society of Exploration Geophysicists (SEG) https://seg.org/
- Society of Environmental and Engineering Geophysicists (EEGS) https://www.eegs.org/
- Geology and Equipment Branch of China Mining Association http://www.chinamining.org.cn/
- International Union of Geological Sciences (IUGS) http://www.iugs.org/
- European Geological Survey Union (Eurogeosurveys) https://www.eurogeosurveys.org/