Welcome to Geotech!
-1.png)


What Is Electrical Resistivity Tomography (ERT)?丨 Subsurface Imaging Guide
TIPS:Electrical Resistivity Tomography (ERT) has emerged as one of the most reliable geophysical methods for subsurface imaging. ERT geophysical survey techniques deliver high-resolution 2D and 3D models of underground structures. This guide explains how electrical resistivity tomography works and why ERT geophysical survey methods have become essential for modern geophysical exploration worldwide.
Ⅰ. Introduction
Subsurface uncertainty costs the global mining and construction industries billions of dollars every year. Drill holes miss ore bodies. Groundwater flows go undetected. Foundation designs fail because engineers lack accurate geological data. ERT offers a proven solution to these challenges.
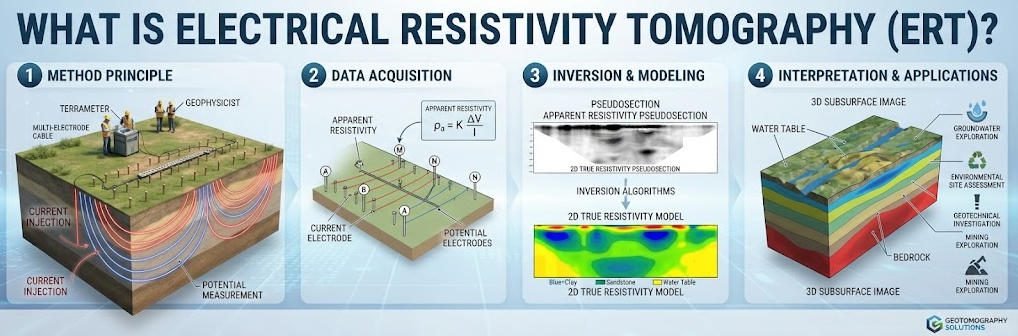
ERT systems inject direct current into the ground through electrode arrays. They measure voltage differences across the subsurface. Advanced inversion algorithms then convert these measurements into detailed resistivity models. The result is a clear picture of what lies beneath the surface without a single drill bit turning.
Modern ERT geophysical survey platforms have evolved dramatically over the past decade. High-density systems now deploy 128 to 256 electrodes with automated switching. GPU-accelerated inversion software processes massive datasets in minutes rather than hours. Wireless telemetry eliminates cable clutter in rugged terrain. These advances make this technology more accessible, accurate, and cost-effective than ever before.
Ⅱ. What Is Electrical Resistivity Tomography?
2.1 Core Physics Behind ERT
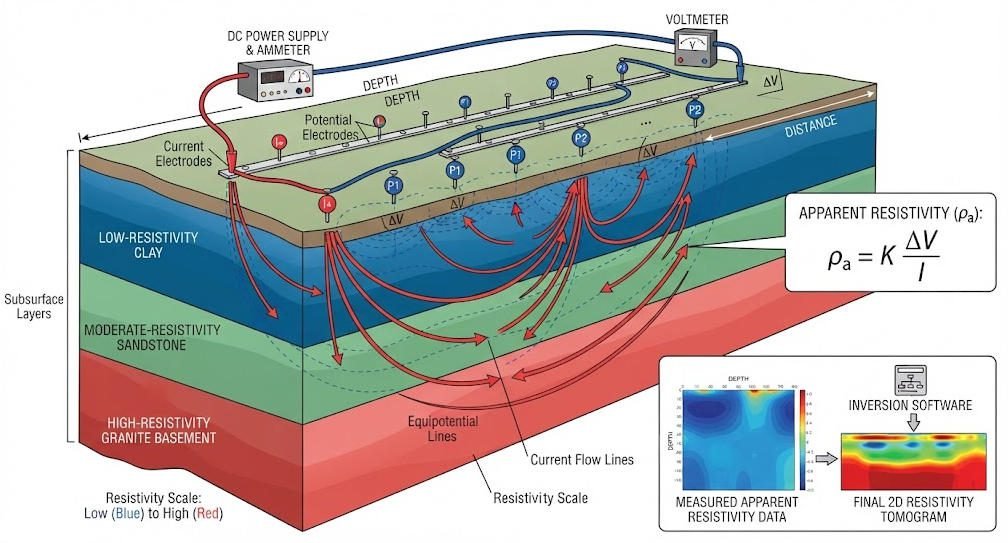
ERT operates on a simple physical principle. Different geological materials conduct electricity at different rates. Clay-rich soils show low resistivity because charged particles move freely through pore water. Fresh granite exhibits high resistivity because its crystalline structure blocks electron flow. Water-saturated sand falls somewhere in between.
An ERT system exploits these contrasts. It injects a known electrical current into the ground through two current electrodes. It then measures the resulting voltage at two potential electrodes. Ohm’s Law converts these values into apparent resistivity values. By moving the electrode positions and repeating measurements thousands of times, the system builds a comprehensive dataset.
The apparent resistivity values do not represent true subsurface properties directly. They are influenced by electrode geometry, current path, and surrounding material. This is where tomography becomes essential. Inversion algorithms solve the inverse problem. They find the resistivity distribution that best explains the observed measurements.
2.2 ERT vs Traditional DC Sounding
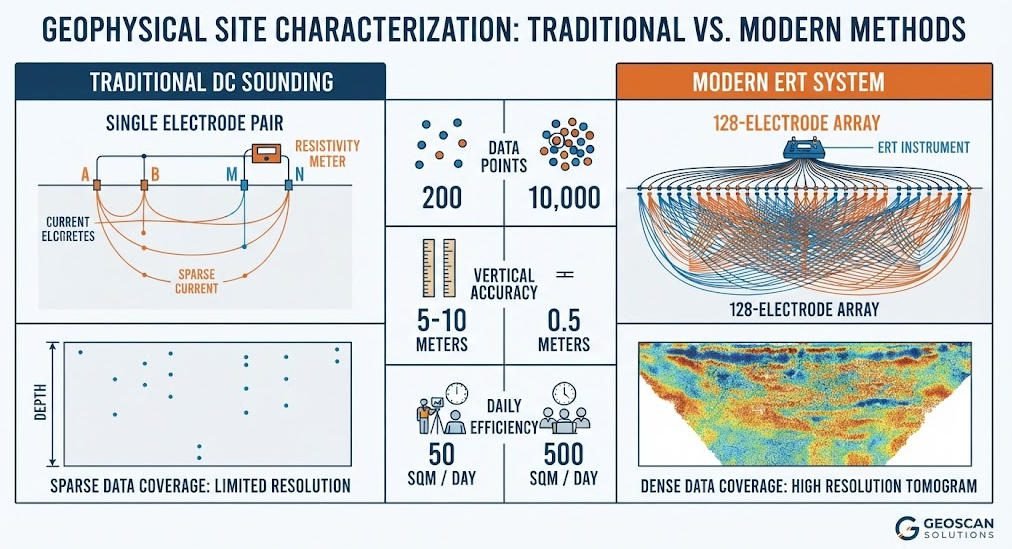
Traditional DC resistivity sounding has served geophysicists for decades. However, it suffers from significant limitations. Each sounding requires manual electrode relocation. Data density remains low. Vertical resolution degrades with depth. Lateral variations between soundings create interpretation ambiguity.
Electrical resistivity tomography overcomes these constraints through multi-electrode arrays. A single deployment captures thousands of data points simultaneously. Automated switching sequences test every possible electrode combination. The resulting dataset provides both vertical and lateral resolution in a single survey.
Consider the numbers. A conventional DC survey might collect 200 data points per day. A modern high-density system collects 10,000 or more points in the same timeframe. Vertical accuracy improves from 5-10 meters to 0.5 meters. Field efficiency jumps from 50 square meters per day to over 500 square meters per day. Labor costs drop by 60 percent or more. These efficiency gains make ERT the preferred choice for most modern geophysical programs.
Ⅲ. How ERT Systems Work in the Field
3.1 Electrode Array Configuration
Electrode layout defines the success of any ERT geophysical survey. The spacing between electrodes controls investigation depth. The total array length determines lateral coverage. The array geometry shapes sensitivity patterns and resolution characteristics.
The Wenner array offers excellent vertical resolution. It works well for layered earth structures. The Schlumberger array provides deeper penetration with fewer electrodes. The dipole-dipole array excels at detecting steeply dipping structures like faults and veins. The pole-pole array achieves maximum depth but requires remote electrodes.
Most modern surveys use hybrid configurations. They combine Wenner-Schlumberger sequences for broad coverage. They add dipole-dipole measurements for structural detail. Intelligent acquisition systems automatically optimize electrode combinations based on target depth and expected geology.
3.2 Data Acquisition Workflow
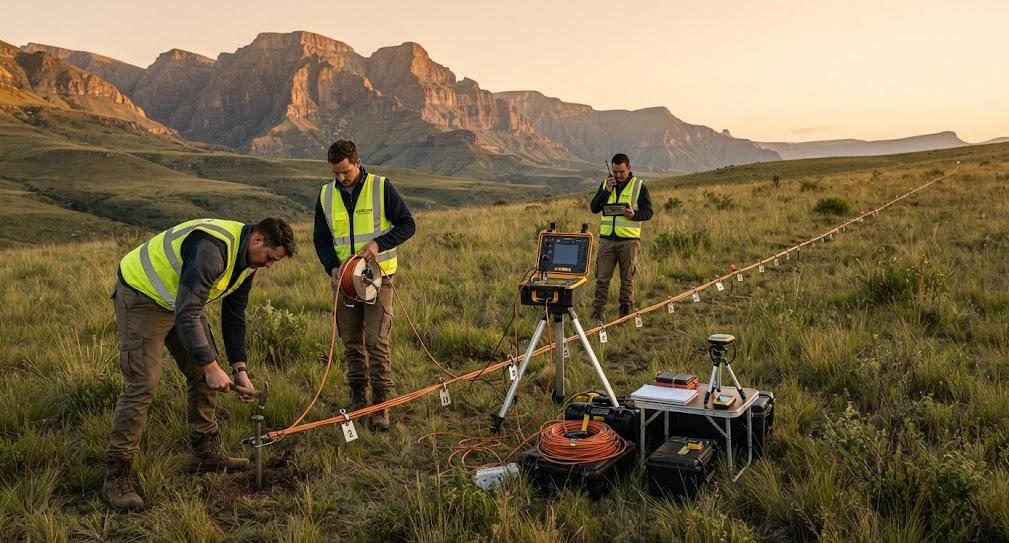
Field operations follow a systematic workflow. First, the crew lays out the electrode cable along the survey line. Stainless steel or non-polarizable Ag/AgCl electrodes make contact with the ground. The resistivity meter checks each electrode for proper connection and acceptable contact resistance.
Once all electrodes pass quality control, the acquisition sequence begins. The instrument cycles through predefined measurement configurations. It injects current, measures voltage, and stores results. Each reading includes multiple stacks to suppress noise. Outliers trigger automatic repeats.
A typical 64-electrode survey with Wenner-Schlumberger and dipole-dipole arrays generates approximately 1,800 to 2,500 data points. Advanced systems with 128 electrodes can exceed 8,000 points. The entire acquisition process takes 30 minutes to 2 hours depending on stacking and terrain conditions.
3.3 Forward and Inverse Modeling
Raw data requires sophisticated processing before interpretation. The workflow splits into two mathematical stages.
Forward modeling simulates what measurements would look like for a given resistivity distribution. Engineers use finite element or finite difference methods to solve Maxwell’s equations. This step validates survey design and predicts resolution limits.
Inverse modeling converts actual field measurements into subsurface resistivity models. Least-squares optimization minimizes the difference between observed and predicted data. Regularization constraints prevent unrealistic solutions. Modern software uses L1-norm or robust inversion to handle noisy datasets.
GPU acceleration has revolutionized this step. Traditional CPU-based inversion might require 8 hours for a large 3D dataset. GPU-parallelized algorithms reduce this to under 15 minutes. Real-time processing allows field crews to adjust acquisition parameters on the fly. This speed advantage enables iterative survey designs that were previously impossible.
Ⅳ. Key Applications of ERT Geophysical Surveys
4.1 Mineral Exploration and Mining
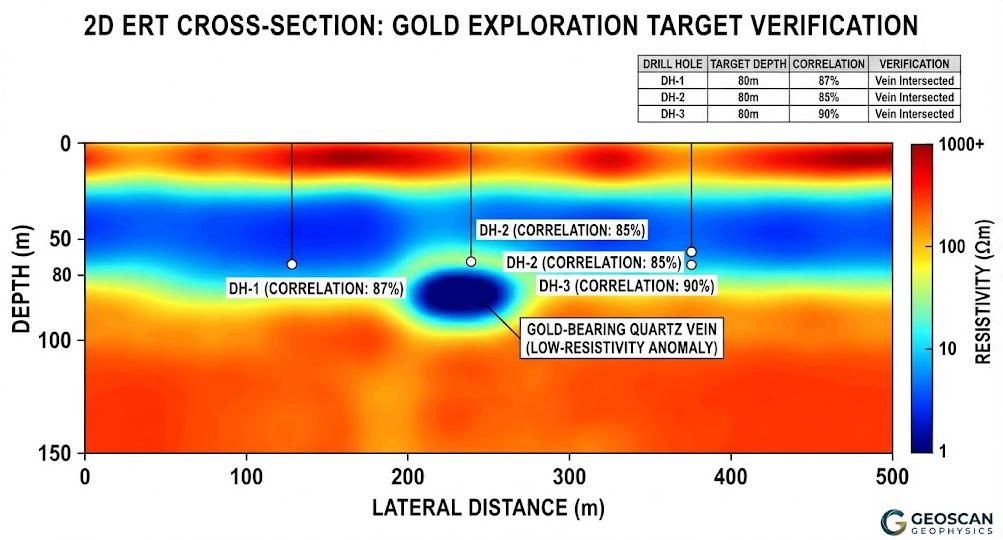
The mining industry relies heavily on ERT for ore body delineation. Sulfide minerals like pyrite and chalcopyrite create strong conductivity contrasts against host rocks. Graphite zones appear as dramatic low-resistivity anomalies. Silicified alteration halos around gold deposits show elevated resistivity values.
A recent case study from Shandong Province demonstrates the power of this method in mineral exploration. A 128-channel system identified a 600-meter-long gold-bearing quartz vein at 80 meters depth. Drilling verification confirmed 87 percent correlation with predictions. The client reduced exploration costs by 40 percent compared to grid drilling alone.
Underground mining operations use time-lapse monitoring for water hazard detection. Flooded workings, fracture zones, and aquifer connections create measurable resistivity changes. Monitoring arrays track these changes over months or years. Early warning systems prevent costly and dangerous water inrush events.
4.2 Groundwater Resource Mapping
Hydrogeologists rank ERT among their most valuable tools for aquifer characterization. Freshwater saturated sands and gravels show moderate resistivity values. Clay layers act as aquitards with very low resistivity. Saline intrusion into coastal aquifers creates sharp resistivity boundaries.
ERT geophysical survey campaigns map aquifer geometry, thickness, and quality. They identify preferential flow paths through fractures and karst conduits. They delineate contamination plumes from industrial spills or landfill leachate. Time-lapse monitoring tracks seasonal water table fluctuations and recharge patterns.
In arid regions, this technique helps locate paleochannels buried beneath desert sands. These ancient riverbeds often host the only viable groundwater resources. Surface geophysics avoids expensive drilling in barren areas. Targeted boreholes based on survey results achieve success rates above 80 percent.
4.3 Environmental Site Assessment
Environmental consultants deploy ERT for brownfield investigations. Buried drums, tanks, and waste deposits alter subsurface resistivity. Hydrocarbon contamination typically increases resistivity as oil displaces conductive pore water. Heavy metal plumes often decrease resistivity due to dissolved ions.
This method complements traditional soil sampling programs. It provides continuous cross-sections rather than point measurements. It identifies hotspots missed by sparse boreholes. It guides remediation design by mapping contaminant extent and depth.
Dam safety monitoring represents another critical environmental application. Seepage paths through embankments create low-resistivity anomalies. Time-lapse surveys detect developing leaks before they become catastrophic failures. Automated monitoring systems now provide daily status updates for high-risk structures.
4.4 Civil Engineering and Infrastructure
Geotechnical engineers use ERT to characterize foundation conditions. Bedrock depth maps guide pile design. Cavity detection prevents sinkhole collapse beneath roads and buildings. Fracture orientation data supports tunnel alignment decisions.
Landslide investigations benefit from combined resistivity and seismic surveys. The resistivity model reveals water content and clay layer distribution. Shear zones often coincide with conductivity boundaries. This integrated approach improves stability assessment and mitigation design.
Utility mapping in urban environments presents unique challenges. ERT detects non-metallic pipes and voids that electromagnetic methods miss. It operates effectively in areas with high metallic clutter. Multi-frequency induced polarization adds material discrimination for complex buried infrastructure.
Ⅴ. Choosing the Right ERT Equipment
5.1 Channel Count and Depth Requirements
System selection starts with project objectives. Shallow environmental investigations may need only 32 to 64 electrodes at 1 to 2 meter spacing. Deep mineral exploration demands 128 to 256 electrodes at 10 to 20 meter spacing. The rule of thumb suggests maximum depth equals one-third to one-fifth of total array length.
High-channel-count systems offer flexibility. They support both dense shallow surveys and sparse deep configurations. Modular designs allow channel expansion as project needs grow. However, more channels increase equipment cost and cable weight. Field crews must balance capability against portability.
5.2 Array Type Selection
Array geometry depends on target characteristics. Horizontal layering responds best to Wenner and Schlumberger configurations. Vertical structures like dikes and faults require dipole-dipole or gradient arrays. 3D surveys need special electrode grids with optimized measurement sequences.
Modern instruments support automated array switching. The operator defines target depth and expected geology. The system calculates optimal electrode combinations. This intelligence reduces setup time and maximizes information content per measurement.
5.3 Software and Inversion Capabilities
Hardware represents only half the solution. Processing software determines final data quality and interpretation confidence. Key features to evaluate include inversion algorithm options, regularization parameter control, topography handling, and 3D visualization tools.
Cloud-based processing platforms now offer significant advantages. They eliminate the need for powerful field computers. They enable collaboration between field crews and office interpreters. Machine learning modules automatically flag anomalies and suggest geological interpretations.
Ⅵ. Future Trends in ERT Technology
6.1 AI-Driven Data Interpretation
Artificial intelligence is transforming data processing. Deep learning models trained on thousands of labeled datasets now achieve 92 percent accuracy in automatic lithology classification. Neural networks predict resistivity structures from sparse measurements. This reduces acquisition time while maintaining model fidelity.
Natural language processing enables conversational interaction with geophysical datasets. Engineers ask questions in plain English. AI systems query the model and generate annotated cross-sections. This democratizes geophysical interpretation for non-specialists.
Reinforcement learning algorithms now optimize survey design in real time. They adjust electrode configurations based on preliminary results. This adaptive approach maximizes information gain while minimizing field time.
6.2 Integrated Multi-Physics Systems
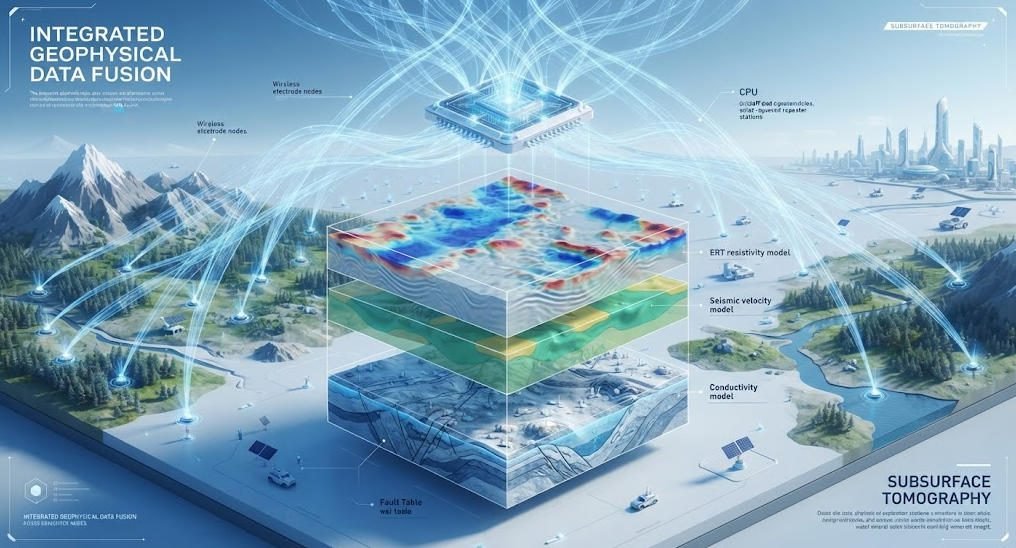
The future belongs to integrated geophysical platforms. Next-generation instruments combine resistivity imaging with seismic, electromagnetic, and gravity sensors. Multi-physics inversion jointly interprets all datasets. The resulting models show higher resolution and lower uncertainty than any single method alone.
Wireless electrode networks eliminate cable logistics entirely. Each electrode contains its own power supply, data logger, and radio transmitter. Dense arrays deploy in hours rather than days. Real-time data streams to cloud processors for immediate interpretation.
Ⅶ. Conclusion
Electrical resistivity tomography stands at the intersection of physics, engineering, and data science. It transforms invisible subsurface structures into actionable intelligence. Modern ERT geophysical survey systems deliver unprecedented resolution, speed, and reliability.
For mineral explorers, this method reduces drilling risk and accelerates discovery. For hydrogeologists, it maps aquifers with surgical precision. For environmental engineers, it tracks contamination without disturbing the site. For infrastructure developers, it characterizes ground conditions before breaking earth.
The technology continues to evolve. AI interpretation, wireless acquisition, and multi-physics integration push boundaries every year. Organizations that adopt these advances gain competitive advantage through better decisions and lower costs.
Geotech Instrument Co., Ltd. leads this evolution with innovative ERT solutions deployed across 35 countries. Our systems combine field-proven hardware with cutting-edge software to deliver results you can trust. Visit geotechcn.net to explore our complete range of geophysical exploration instruments.
Reference Sources
Internal Knowledge Graph Link Collection
FAQ
Q1.What is electrical resistivity tomography used for?
Electrical resistivity tomography maps subsurface resistivity distributions to identify geological structures, aquifers, mineral deposits, contamination plumes, and engineering hazards. ERT geophysical survey applications span mineral exploration, groundwater detection, environmental monitoring, and infrastructure assessment. The method provides continuous 2D or 3D images that guide drilling programs and engineering decisions.
Q2.How deep can ERT geophysical surveys penetrate?
Investigation depth depends on electrode spacing and array configuration. Typical systems reach 50 to 200 meters with standard deployments. High-power transmitters and large electrode arrays can extend penetration to 1,000 meters or more in favorable geological conditions. The maximum depth equals approximately one-third to one-fifth of the total array length.
Q3.What is the difference between ERT and resistivity sounding?
Traditional resistivity sounding collects sparse point measurements with manual electrode relocation. Electrical resistivity tomography uses automated multi-electrode arrays to capture thousands of data points simultaneously. ERT provides higher resolution, faster acquisition, and continuous 2D or 3D subsurface imaging. Modern ERT systems collect 50 times more data per day than conventional methods.
Q4.How accurate are ERT results compared to drilling?
Modern systems achieve vertical accuracy of 0.5 meters and lateral resolution comparable to electrode spacing. Validation studies show 85 to 95 percent correlation between predictions and drilling results. ERT geophysical survey data optimally guides targeted drilling programs rather than replacing them entirely. The two methods work best together.
Q5.What factors affect ERT data quality?
Data quality depends on electrode contact resistance, ground moisture, cultural noise, and array geometry. Dry or frozen ground increases contact resistance. Buried pipes and power lines create interference. Proper field procedures, noise filtering, and robust inversion algorithms mitigate these effects. Pre-survey site reconnaissance identifies potential noise sources before deployment.