Welcome to Geotech!
-1.png)


Surface Geophysics: Centralized vs Distributed High-Density ERT System Compared
TIPS:High-density electrical method and electrical resistivity tomography are reshaping modern geophysical surveys. This guide compares centralized and distributed electrical resistivity tomography systems. You will learn which high-density electrical method fits your project. We cover technical architecture, field scenarios, and cost models for electrical resistivity tomography equipment.
Ⅰ. Introduction to High-Density Electrical Methods
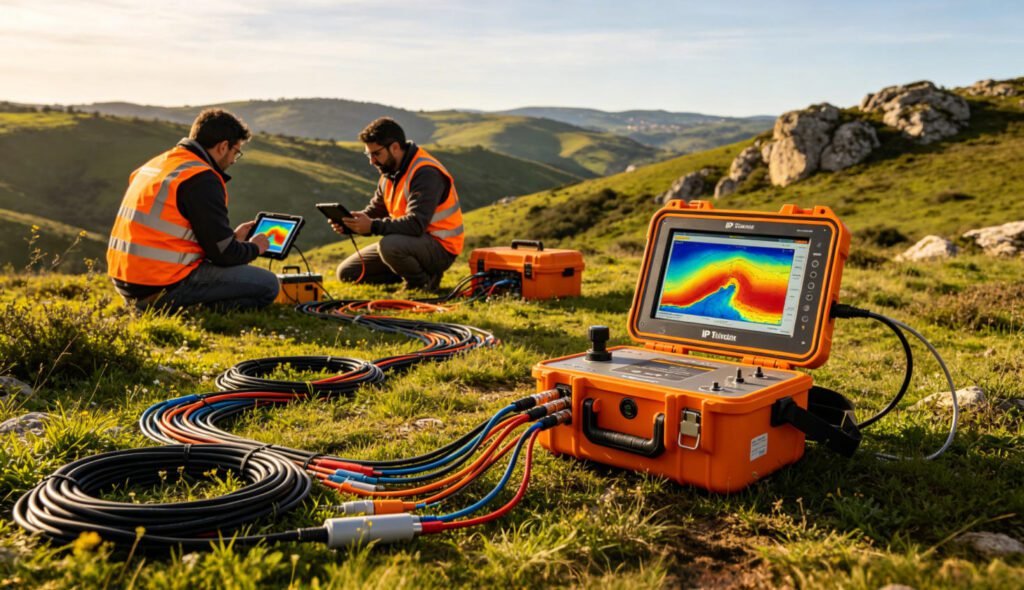
High-density electrical methods (HDEM) have transformed subsurface imaging. These techniques replace single-point measurements with continuous profiling. Engineers now map geological structures faster and with greater precision.
The global electrical resistivity tomography equipment market reached $1.42 billion in 2025. Analysts project growth to $2.61 billion by 2034. This expansion reflects rising demand for non-invasive subsurface characterization across infrastructure, mining, and environmental sectors. citeweb_search:2#1
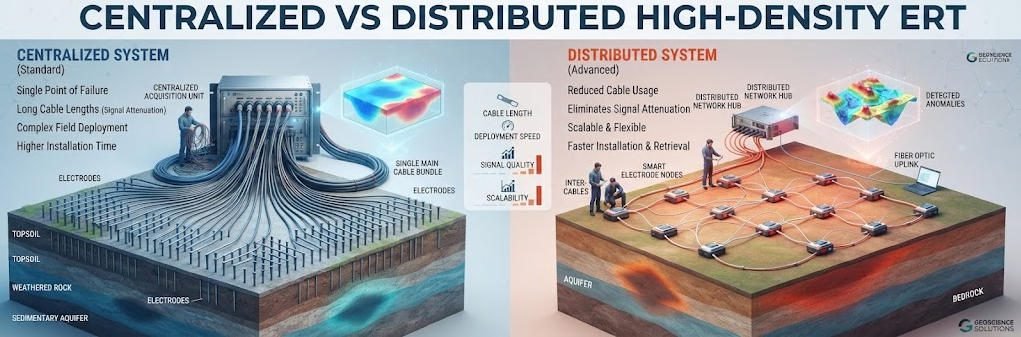
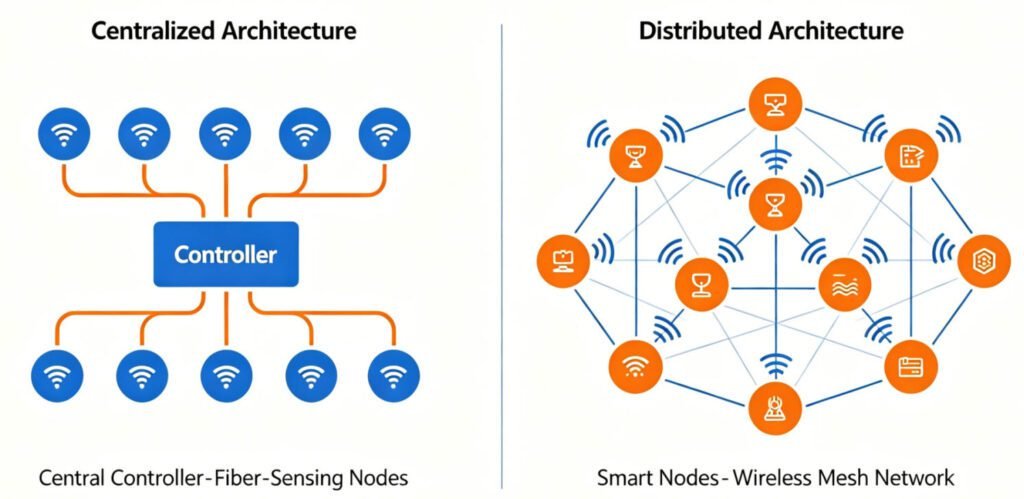
Two primary architectures dominate the field. Centralized systems gather data at a single hub. Distributed systems process data at individual nodes. Each approach delivers distinct advantages. Your project requirements determine the optimal choice.
Ⅱ. Core Technical Principles
1. What Is High-Density Electrical Method
A high-density electrical method deploys multiple electrodes along a survey line. The system injects direct current into the ground. It measures voltage differences between electrode pairs. Software then converts these readings into resistivity models.
This approach differs from traditional vertical electrical sounding (VES). VES provides data at a single point. HDEM delivers continuous 2D or 3D profiles. The result is a complete subsurface image rather than isolated readings.
2. Centralized System Architecture
Centralized systems rely on a single controller. All electrodes connect to this central unit through multi-core cables. The controller manages current injection and voltage measurement sequences. Data flows back to one processing point.
Key components include:
- A central acquisition unit with 128+ channels
- Multi-core transmission cables
- A laptop or tablet for real-time monitoring
- Centralized inversion software
Explore Geotech’s GIM-10 Multi-channel Intelligent Resistivity & IP Meter for integrated centralized and distributed capabilities.
3. Distributed System Architecture
Distributed systems use smart nodes. Each node contains its own processor, memory, and communication module. Nodes connect through wireless mesh networks or short cable links. They operate independently and synchronize through GPS timing.
Key components include:
- Smart electrode nodes with ARM processors
- Wireless or short-link communication modules
- RTK positioning systems
- Solar or battery power supplies
View Geotech’s WERT-4B Distributed High-Density System for flexible node configurations.
Ⅲ. Application Scenario Analysis
1. Centralized System Use Cases
Centralized systems excel in large-scale surveys. They cover broad areas with minimal setup complexity. Typical applications include:
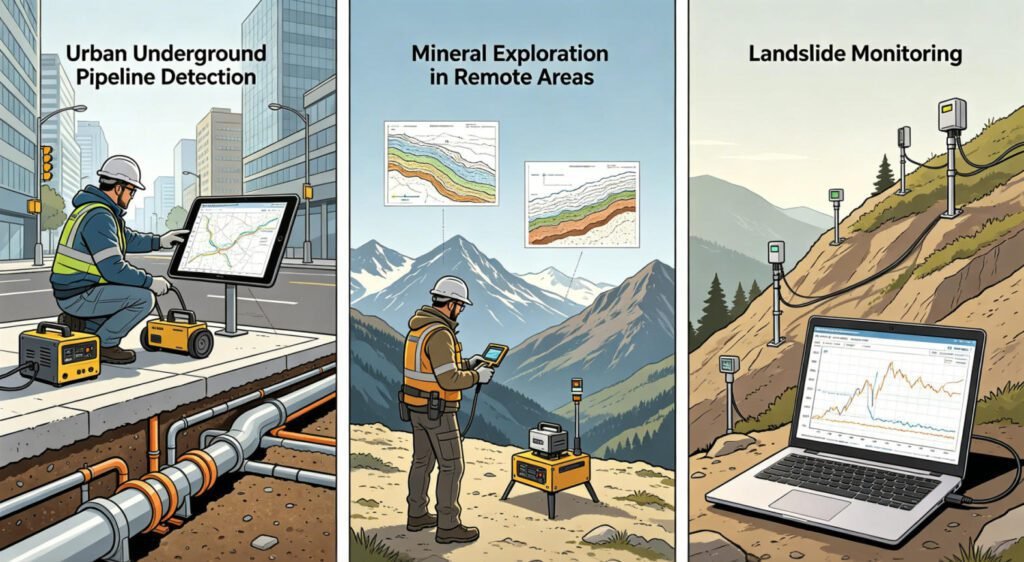
- Regional mineral resource assessments
- Long-distance infrastructure corridors (railways, highways)
- Deep geological structure detection (depth > 200 m)
- Dam foundation and reservoir investigations
A single centralized setup can cover up to 10 km². Parallel multi-task measurements boost efficiency. Field teams deploy the system once and acquire data continuously.
2. Distributed System Use Cases
Distributed systems shine in complex environments. Their modular design adapts to tight spaces and obstacles. Typical applications include:
- Urban underground utility mapping
- Landslide and slope stability monitoring
- Archaeological site investigations
- Shallow high-resolution surveys (depth < 50 m)
Centimeter-level positioning accuracy enables precise anomaly detection. Wireless nodes avoid cable clutter in congested urban settings.
3. Hybrid Deployment Trends
Modern projects increasingly combine both approaches. Teams use centralized systems for regional reconnaissance. They deploy distributed nodes for detailed target areas. This hybrid strategy optimizes both cost and resolution.
Learn more about 2D vs 3D Electrical Resistivity Imaging methods to complement your HDEM selection.
Ⅳ. Data Processing Architecture
1. Centralized Processing Pipeline
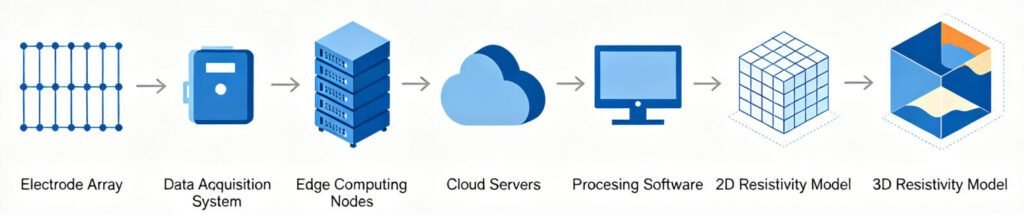
Centralized architectures stream all data to a single server. High-performance GPU clusters handle terabyte-level datasets. This model suits batch processing and detailed inversion work.
Processing steps include:
- Raw data acquisition and storage
- Noise filtering and quality control
- 2D or 3D resistivity inversion
- Geological interpretation and reporting
Latency is higher. Field teams typically review results after survey completion. This workflow fits projects without real-time decision requirements.
2. Edge Computing in Distributed Nodes
Distributed nodes preprocess data locally. FPGA chips inside each node perform initial filtering and stacking. Only compressed results travel to the central hub. This reduces bandwidth needs by up to 80%.
Local processing enables:
- Immediate anomaly detection
- Adaptive survey adjustments
- Reduced data transmission costs
- Fault tolerance if individual nodes fail
3. Real-Time vs Batch Processing
Real-time capability distinguishes distributed systems. Engineers monitor resistivity changes as they happen. This feature proves critical for:
- Pipeline leak detection
- Tunnel advance monitoring
- Dynamic landslide observation
- Environmental contamination tracking
Centralized systems favor batch processing. They accumulate large datasets for comprehensive inversion. This approach yields deeper insights but requires post-survey analysis.
Ⅴ. Equipment Configuration and Cost Analysis
1. Centralized System Cost Structure
| Component | Cost Share | Technical Specifications |
|---|---|---|
| Central Controller | 45% | 128-channel synchronous acquisition |
| Electrode Array | 30% | Stainless steel electrodes, 5–20 m spacing |
| Data Transmission | 25% | Industrial wireless mesh network |
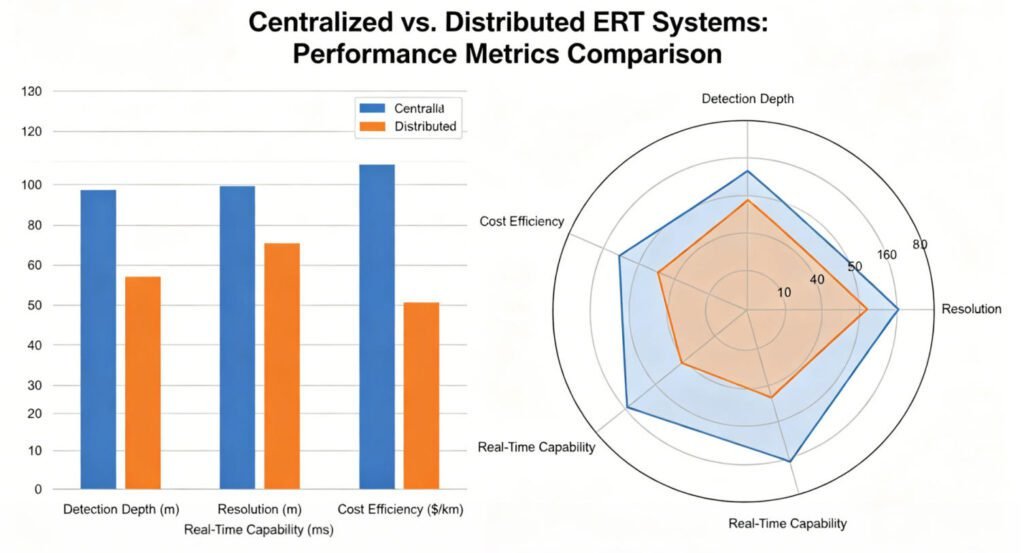
Centralized systems require higher upfront investment. However, marginal costs drop with repeated use. One system serves multiple projects over its lifespan.
Check Geotech’s WDA-1 DC Resistivity IP Sounding Meter for conventional electrical method applications.
2. Distributed System Cost Structure
| Component | Cost Share | Technical Specifications |
|---|---|---|
| Smart Nodes | 60% | ARM processor + 4G module |
| Positioning System | 25% | Centimeter-level RTK accuracy |
| Power System | 15% | Solar + lithium battery hybrid |
Distributed systems use modular pricing. Teams purchase nodes as needed. Short-term projects avoid large capital outlays. Unit-area costs run higher, but precision justifies the premium.
3. ROI Comparison Model
Centralized systems deliver better ROI for long-term programs. Survey teams amortize equipment costs across hundreds of kilometers. Distributed systems offer superior ROI for short-duration, high-precision contracts. Clients pay for targeted accuracy without unused capacity.
Ⅵ. Technical Selection Decision Framework
1. Decision Tree
Use this simple framework to select your system:
Step 1: Do you need real-time data feedback?
- Yes → Choose Distributed System
- No → Continue to Step 2
Step 2: Is measurement depth greater than 100 m?
- Yes → Choose Centralized System
- No → Continue to Step 3
Step 3: Is budget limited for high-precision local work?
- Yes → Choose Distributed System
- No → Choose based on team preference
2. Selection Checklist
Before procurement, verify these factors:
- [ ] Survey depth requirements
- [ ] Real-time monitoring needs
- [ ] Terrain accessibility and obstacles
- [ ] Budget constraints and project duration
- [ ] Data processing infrastructure
- [ ] Team technical expertise
- [ ] Equipment portability requirements
Ⅶ. 2026 Market Trends and Outlook
The electrical resistivity tomography market continues to evolve. Three trends shape the industry in 2026:
First, multi-electrode systems now dominate. These systems hold 61.4% of market share. Channel counts rise from 64 to 256 electrodes per deployment. citeweb_search:2#1
Second, AI-powered inversion software reduces processing time. Tasks that once required days now finish in hours. This acceleration supports field-based decision making.
Third, Asian manufacturers expand global reach. Chinese suppliers offer systems at 25–40% below Western price points. Quality improvements challenge traditional market leaders. citeweb_search:2#1
Geotechnical investigation leads application demand at 28.3% of revenue. Groundwater exploration follows at 22.8%. Mining and environmental studies drive additional growth. citeweb_search:2#1
Ⅷ. Conclusion
Centralized and distributed high-density electrical methods serve different missions. Centralized systems conquer scale and depth. Distributed systems master precision and speed. Your project goals dictate the right tool.
Modern geophysical teams increasingly maintain both capabilities. They deploy centralized arrays for regional work. They add distributed nodes for detailed targets. This flexible approach maximizes survey efficiency and data quality.
Choose centralized systems for deep, broad, budget-conscious programs. Choose distributed systems for urban, real-time, high-resolution tasks. Either way, high-density electrical methods deliver subsurface clarity that traditional techniques cannot match.
Reference Sources
| Organization | URL |
|---|---|
| American Geophysical Union (AGU) | https://www.agu.org/ |
| Society of Exploration Geophysicists (SEG) | https://seg.org/ |
| European Association of Geoscientists & Engineers (EAGE) | https://www.eage.org/ |
| US Geological Survey (USGS) – Geophysics | https://www.usgs.gov/programs/earthquake-hazards/geophysics |
| British Geological Survey (BGS) | https://www.bgs.ac.uk/ |
FAQ
What is the difference between centralized and distributed ERT systems?
A: Centralized ERT systems use one controller for all electrodes. Data flows to a single hub. Distributed ERT systems use smart nodes. Each node processes data locally. Centralized systems suit large-scale deep surveys. Distributed systems excel in urban and real-time applications.
How deep can high-density electrical methods detect?
A: Detection depth depends on electrode spacing and ground resistivity. Centralized systems typically reach 200–500 m. Distributed systems usually cover 0–50 m with high resolution. Larger spacing increases depth but reduces resolution.
Which ERT system is better for urban geophysical surveys?
A: Distributed systems work better in cities. Wireless nodes avoid cable clutter. Centimeter-level GPS accuracy maps utilities precisely. Real-time monitoring detects underground changes instantly.
What is the cost range for high-density electrical resistivity equipment?
A: Entry-level single-electrode systems cost $3,000–$12,000. Professional multi-electrode centralized systems range from $25,000–$80,000. High-specification 3D distributed systems with 128+ channels can reach $80,000–$150,000.
How do I choose between 2D and 3D electrical resistivity imaging?
A: Choose 2D imaging for linear profiles and faster surveys. Choose 3D imaging for complex sites with off-line anomalies. 3D requires more electrodes and processing time. It delivers superior spatial accuracy for challenging geology. Read our 2D vs 3D ERT comparison guide for detailed guidance.