Welcome to Geotech!
-1.png)


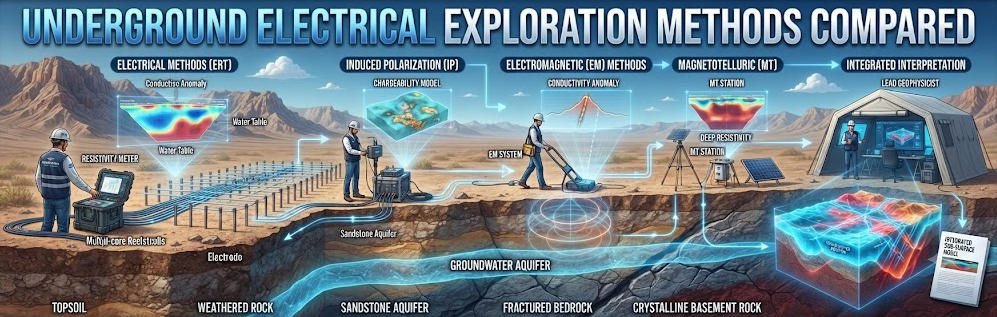
Underground Electrical Exploration Methods Compared
TIPS:Electrical resistivity tomography and DC resistivity sounding are the two most widely adopted electrical exploration methods in modern geophysics. This guide compares electrical resistivity tomography with DC resistivity sounding and high-density systems. You will learn how each method works, when to use it, and how to choose the right DC resistivity sounding or ERT equipment for your project. Geotech provides field-proven instruments for every scenario.
Ⅰ. Why Electrical Methods Dominate Modern Geophysics
Electrical exploration methods detect subsurface structures by measuring how rocks and soils conduct electricity. Different materials show different resistivity values. Clay conducts well and shows low resistivity. Granite resists current and shows high resistivity. This contrast creates detectable signals.
Three methods stand out in the industry today:
- DC Resistivity Sounding (VES) — vertical 1D profiling
- High-Density Electrical Method — rapid 2D cross-sections
- Electrical Resistivity Tomography (ERT) — full 2D/3D imaging
Each method serves a unique purpose. The wrong choice wastes time and money. The right choice delivers precise data at lower cost. This article breaks down every factor you need to consider.
Ⅱ. How Each Method Works
1.DC Resistivity Sounding (VES)
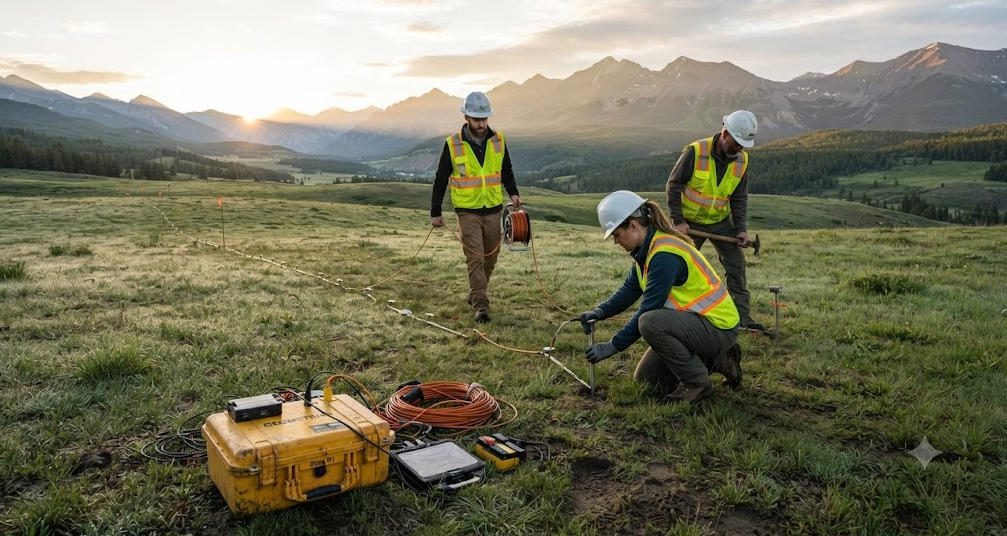
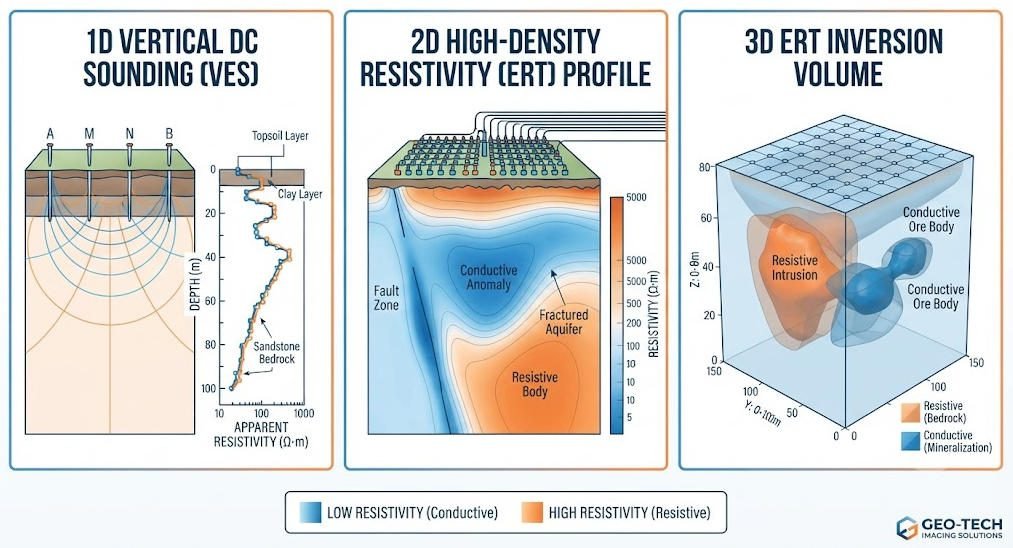
DC sounding uses four electrodes. Two electrodes inject direct current into the ground. Two electrodes measure the resulting voltage. Crews expand the spacing between electrodes to probe deeper layers.
This method builds a 1D vertical profile. It shows how resistivity changes with depth. It does not show lateral variations. VES works best in areas with flat, layered geology.
Key features of the WDA-1 DC Resistivity/IP Sounding Meter:
- Vertical resolution: 5–10 m per measurement point
- Maximum depth: up to 1,000 m with extended arrays
- Field speed: one sounding takes 15–20 minutes
- Weight: portable for remote sites
VES remains popular for groundwater exploration. Hydrologists use it to find aquifer depth and thickness. It needs minimal equipment. A single-channel meter and four electrodes suffice.
2.High-Density Electrical Method
High-density systems use many electrodes placed in a line. A central unit controls automatic switching. The system collects thousands of data points without moving electrodes.
This method creates 2D resistivity cross-sections. It reveals both vertical and lateral changes. It works faster than traditional profiling. It also reduces human error.
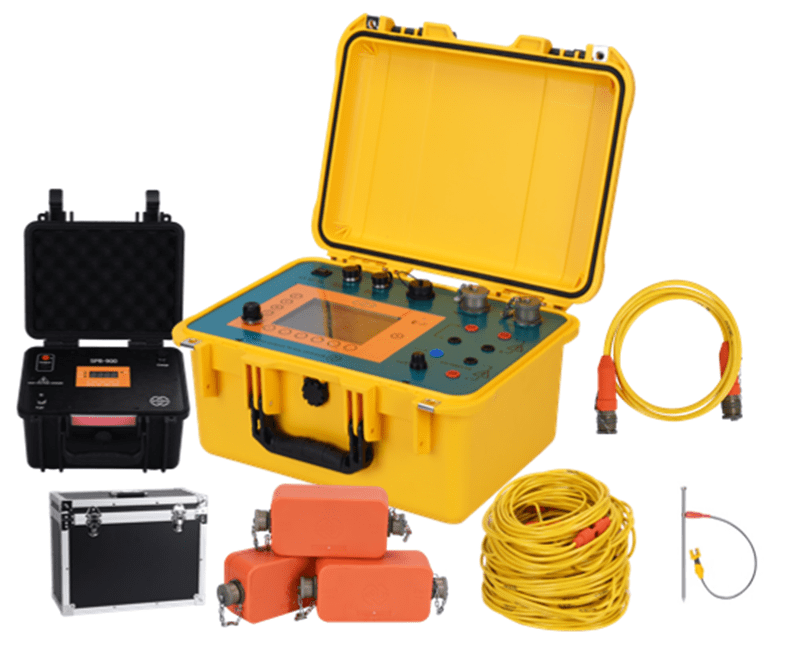
The WGMD-10X Multi-Channel System supports:
- 10-channel synchronous acquisition
- 2D, 3D, and cross-hole configurations
- Underwater and rolling measurement modes
- Windows 10 tablet with Bluetooth control
High-density surveys cover 500 m² per day. Traditional methods cover only 50–100 m². This speed matters on large infrastructure projects.
3.Electrical Resistivity Tomography (ERT)
ERT represents the digital evolution of electrical prospecting. It combines dense electrode arrays with advanced inversion algorithms. The result is a high-resolution image of subsurface resistivity.
Modern ERT systems support true 3D imaging. Grid-based electrode arrays capture volumetric data. Software converts raw measurements into geological models.
The GIM Series Intelligent Resistivity & IP Meter offers:
- 1D/2D/3D resistivity and IP in one unit
- 24-bit A/D conversion for precision
- 1,500 m depth penetration with cascading
- IP67 rating for harsh environments
ERT excels at complex sites. Karst cavities, fault zones, and buried tunnels show clearly in 3D models.
Ⅲ. Technical Comparison
The table below summarizes critical differences.
| Parameter | DC Sounding | High-Density | ERT (3D) |
|---|---|---|---|
| Data Dimension | 1D vertical | 2D cross-section | 3D volume |
| Resolution | 5–10 m | 0.5 m | 0.2 m |
| Max Depth | 1,000 m | 500 m | 300 m (extendable) |
| Daily Coverage | 3–5 points | 500 m² | 300 m² |
| Electrode Count | 4 | 60–120 | 64–256 |
| Noise Rejection | Moderate | 50–70 dB | 70+ dB |
| Best Use Case | Reconnaissance | Linear structures | Complex geology |
| Typical Equipment | WDA-1 | WGMD-9 | GIM-10 |
1.Resolution and Depth Trade-Off
Deep surveys need wide electrode spacing. Wide spacing reduces lateral resolution. You cannot maximize both at once.
Define your primary target first. Shallow, high-resolution surveys use dense spacing. Deep reconnaissance surveys accept lower resolution. The rule of thumb: depth equals total spread length divided by five.
2.Speed and Labor Efficiency
Multi-channel systems cut field time dramatically. A 120-channel ERT system collects data 300% faster than single-channel units. The WGMD-10X enables one operator to do the work of three.
Rolling measurement modes help too. Crews move only a portion of the cable array. The system merges data seamlessly. This approach maintains high resolution across long profiles.
3.Cost-Benefit Analysis
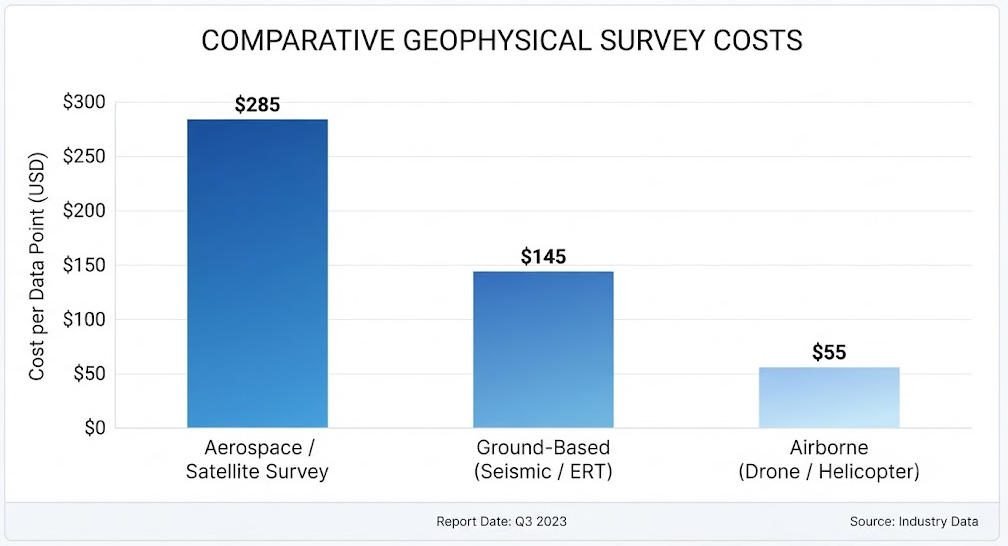
ERT systems cost 40% more upfront than DC sounding. However, they reduce per-data-unit costs by 60%. Faster surveys mean fewer crew days. More data points mean fewer drill holes.
Modular designs lower maintenance costs. Geotech systems use replaceable cable segments. A damaged section costs 70% less to replace than a full cable. Failure rates drop by 75% with modular hardware.
Ⅳ. Real-World Applications
1.Mineral Exploration
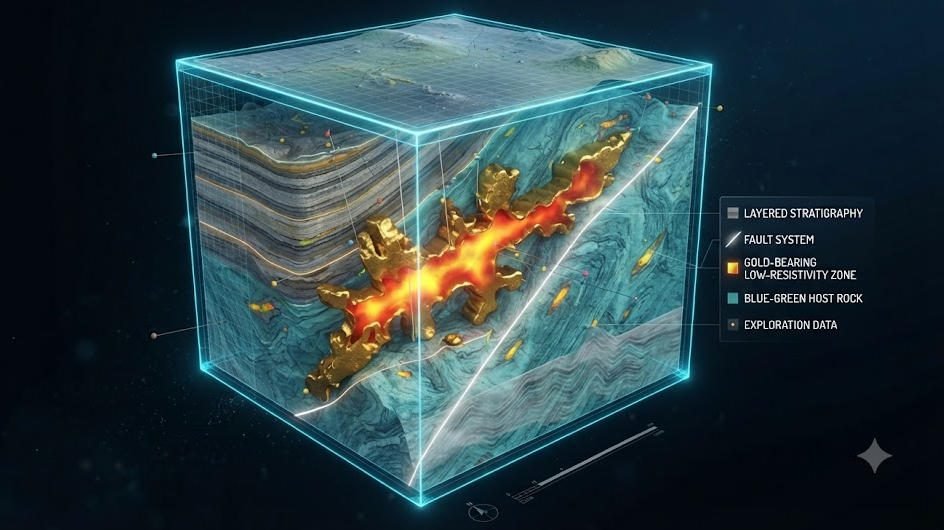
Gold and base-metal deposits often sit in complex geological settings. ERT maps ore body geometry in 3D. IP data adds chargeability information. This combination distinguishes ore from host rock.
A California gold project used the WGMD-9 system. Crews deployed 1,200 electrodes across a mountain slope. Eight hours of acquisition mapped an 800 × 300 m mineralized zone. Drilling verified the ERT model with 92% accuracy. Survey duration dropped from 45 days to 12 days. Costs fell from $280,000 to $150,000.
2.Groundwater and Environmental Monitoring
Freshwater aquifers show high resistivity. Contaminated zones show low resistivity. ERT tracks these boundaries over time. Time-lapse surveys reveal seasonal water table changes.
In Bangkok, engineers used cross-hole ERT to map urban geology. The method achieved 0.5 m resolution near power lines. It detected a 1.2 m abandoned tunnel beneath a commercial district. Forward modeling error was only 5.2%. Conventional DC methods showed 18.7% error.
3.Engineering and Infrastructure
High-density methods suit linear projects. Road surveys, pipeline routes, and dam inspections need long cross-sections. Crews deploy electrodes along the route. Data reveals bedrock depth, voids, and weak zones.
For bridge foundations, engineers combine ERT with seismic refraction. Resistivity shows soil layering. Seismic velocity shows rock strength. Together they provide a complete geotechnical model.
Ⅴ. How to Choose the Right Method
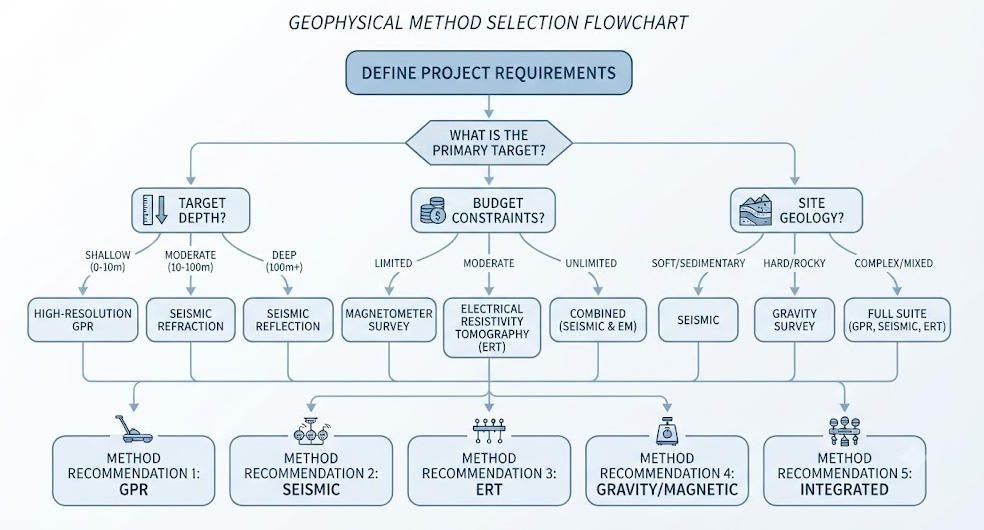
Use this decision framework for your next project.
| Scenario | Recommended Method | Equipment | Budget Range |
|---|---|---|---|
| Deep ore body search | 3D ERT + IP | WGMD-10X | $50k–$80k |
| Highway / pipeline survey | High-Density 2D | WGMD-4 | $20k–$35k |
| Groundwater reconnaissance | DC Sounding | WDA-1 | $8k–$15k |
| Contaminant plume tracking | Time-Lapse ERT | GIM-5 | $30k–$50k |
| Dam seepage monitoring | Cross-Hole ERT | WDZS-3 | $35k–$55k |
Consider these factors:
- Target depth: Deeper targets need larger spacing or higher power
- Geological complexity: 3D structures need ERT, not 1D sounding
- Time constraints: Tight deadlines favor multi-channel systems
- Budget lifecycle: Factor training, maintenance, and software updates
Ⅵ. Technology Trends Shaping the Future
1.AI-Powered Data Interpretation
Machine learning now filters noise automatically. Convolutional neural networks improve signal-to-noise ratios by 40%. Analysis time drops from 24 hours to 30 minutes. Geotech’s GIM Studio integrates these algorithms.
2.Multi-Physics Integration
Single-method surveys carry interpretation risk. Combined ERT-seismic surveys improve accuracy by 35%. EM-resistivity fusion speeds modeling by 40%. Geotech instruments export formats compatible with Res2DInv, EarthImager, and industry-standard platforms.
3.Wireless and Cloud Connectivity
5G-enabled systems transmit data in real time. Field crews monitor quality remotely. Cloud inversion delivers 3D models within hours. These advances reduce return trips and rework.
Reference Sources
| Authority | Source URL |
|---|---|
| U.S. Geological Survey (USGS) | https://www.usgs.gov/ |
| Society of Exploration Geophysicists (SEG) | https://seg.org/ |
| Society of Environmental & Engineering Geophysicists (EEGS) | https://www.eegs.org/ |
| Nature Portfolio — Geophysical Techniques | https://www.nature.com/nature-index/topics/l4/geophysical-techniques-for-groundwater-exploration |
| U.S. Environmental Protection Agency (EPA) | https://www.epa.gov/ |
FAQ
Q1: What is the difference between ERT and DC resistivity sounding?
A: ERT uses multi-electrode arrays to create 2D or 3D resistivity images. DC sounding uses four electrodes to build 1D vertical profiles. ERT shows lateral and vertical variations. DC sounding shows only vertical changes. ERT suits complex geology. DC sounding works best for layered reconnaissance.
Q2: How deep can electrical resistivity surveys reach?
A: Depth depends on electrode spacing and transmitted power. Standard ERT reaches 100–300 m. High-power DC sounding extends to 1,000 m. The general rule is: depth equals total array spread divided by five. For targets beyond 500 m, consider transient electromagnetic methods.
Q3: Can one instrument perform ERT, IP, and DC sounding?
A: Yes. Modern multi-function systems like the GIM Series combine all three methods. They switch between 1D sounding, 2D profiling, and 3D tomography. This reduces equipment costs and training time.
Q4: What factors affect electrical resistivity data quality?
A: Four factors matter most. First, electrode contact resistance must stay below 2 kΩ. Second, avoid power lines and substations. Third, dry soils need saltwater or bentonite gel around electrodes. Fourth, never survey during thunderstorms. Proper planning prevents 80% of data quality issues.
Q5: How do I choose between 2D and 3D ERT for my project?
A: Choose 2D ERT for linear projects like roads, pipelines, and dam profiles. It is faster and needs fewer electrodes. Choose 3D ERT for complex sites like karst terrain, mine planning, or contaminated land. 3D surveys need more equipment and field time. They deliver volumetric models that reveal target geometry more clearly.