Welcome to Geotech!
-1.png)


What is Resistivity Imaging Systems?丨ERT Technology Compared
TIPS:Resistivity imaging systems transform how geophysicists map underground structures. This guide compares 2D and 3D electrical resistivity tomography for subsurface exploration projects. You will discover how resistivity imaging systems detect ore bodies, monitor groundwater, and assess infrastructure using modern electrical resistivity tomography methods. We cover electrode arrays, inversion algorithms, and high-density resistivity applications for advanced geophysical surveys.
Ⅰ. Fundamentals of Resistivity Imaging Systems
Resistivity imaging systems measure how earth materials resist electric current. Different substances conduct electricity differently. Clay-rich soils show low resistivity. Dry granite displays high values. Water content dramatically affects readings.
1. How Electrical Resistivity Tomography Works
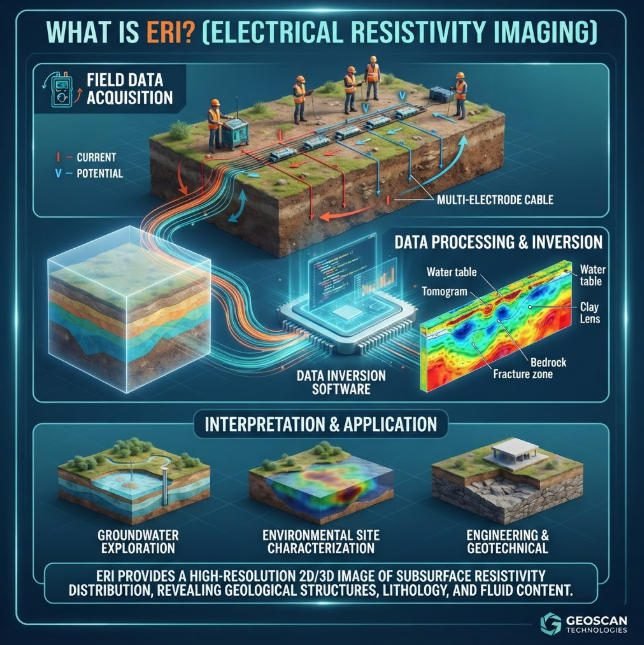
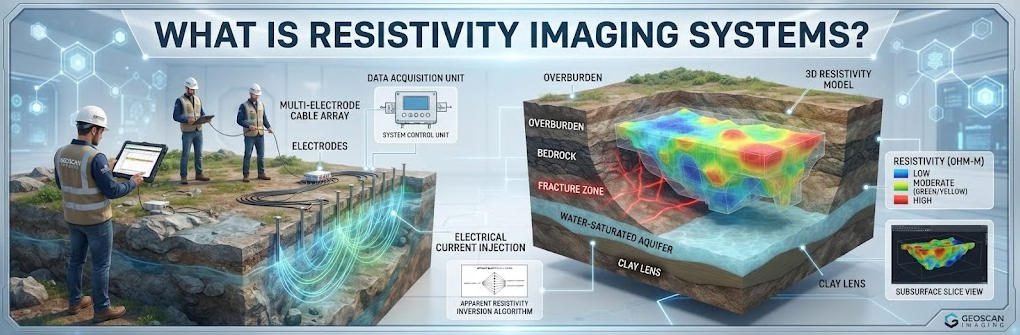
ERT injects direct current through surface electrodes. Potential electrodes measure voltage differences. The instrument calculates apparent resistivity. Software converts these values into cross-sections or volumes.
Ohm’s law governs the basic physics. Current flows between two electrodes. Voltage drops across the ground. Resistivity equals voltage divided by current times a geometric factor. This simple relationship enables complex imaging.
Modern systems automate electrode switching. Multi-core cables connect dozens of electrodes. Computer-controlled sequences acquire thousands of measurements. Inversion algorithms reconstruct subsurface models from this data.
2. Evolution from DC Sounding to High-Density Arrays
Early geophysicists used four-electrode arrays. They moved equipment manually between stations. Vertical electrical sounding probed depth at single points. Data coverage remained sparse.
High-density resistivity method revolutionized this field. Automated switching connects hundreds of electrodes. Dense spatial sampling improves resolution. Tomographic inversion produces detailed images. This evolution enabled practical 3D surveys.
3. Key Components of Modern ERT Systems
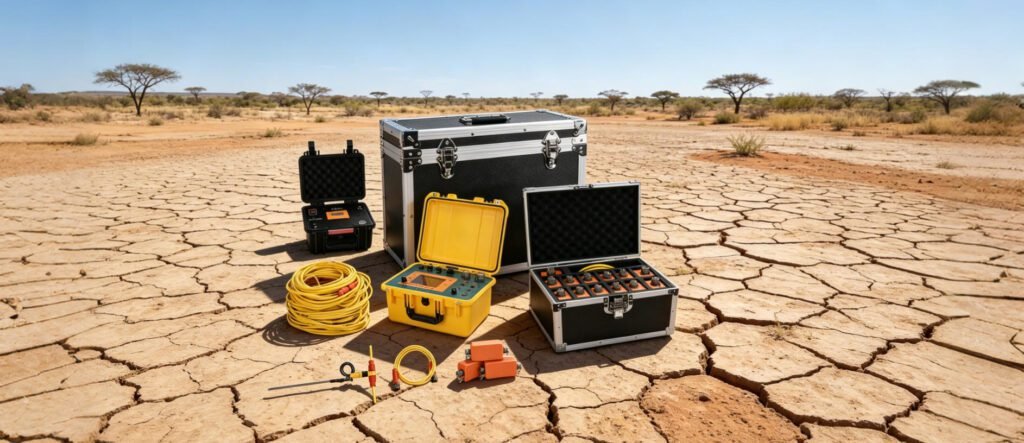
A complete system includes several elements. The resistivity meter generates current and measures voltage. Multi-electrode cables connect to electrode arrays. Switching units route signals automatically. Processing software creates final images.
Electrode quality affects measurement accuracy. Stainless steel electrodes resist corrosion. Non-polarizable Ag/AgCl electrodes reduce contact noise. Electrode spacing determines spatial resolution. Typical surveys use 1 to 10 meter intervals.
Ⅱ. 2D vs 3D Resistivity Imaging: Technical Comparison
Choosing between 2D and 3D ERT affects project outcomes. This section compares both approaches systematically.
1. Data Dimensions and Spatial Resolution
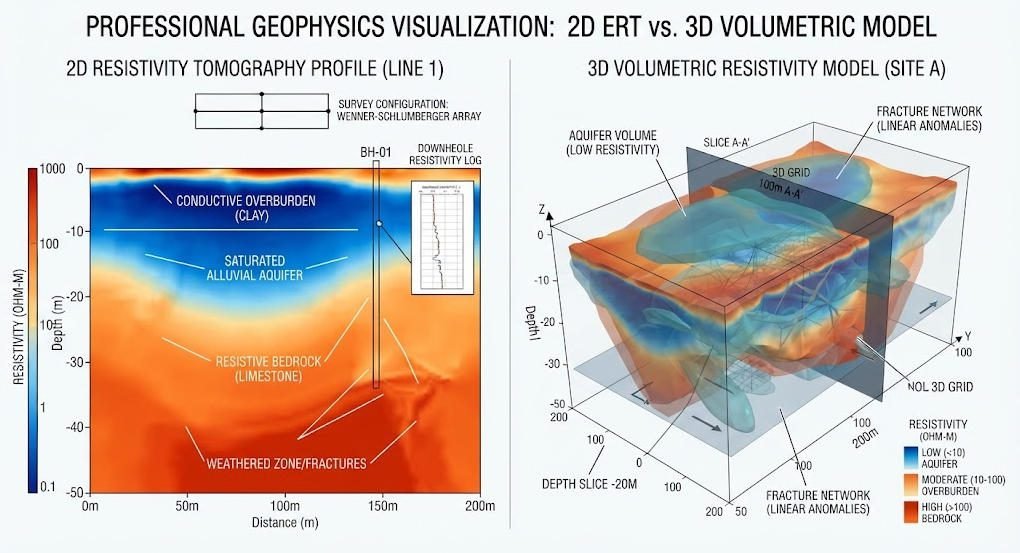
2D ERT creates cross-sectional profiles. Measurements align along a single line. Results show resistivity variation with depth. This approach suits linear targets like roads or pipelines.
3D ERT produces volumetric models. Electrodes deploy across an area. Measurements sample from multiple directions. Results reveal complex geometries. This approach maps irregular ore bodies or contamination plumes.
Resolution differs significantly. 2D systems typically achieve 0.5 to 2 meter resolution. 3D systems with dense arrays reach 0.05 to 0.5 meters. The improvement justifies increased deployment complexity for many projects.
2. Electrode Deployment Efficiency
2D surveys require simpler logistics. Single cable lines deploy quickly. Operators walk predefined transects. Setup times range from hours to a day. This efficiency suits reconnaissance surveys.
3D surveys demand more planning. Grids require careful layout. Multiple cable lines connect in parallel. Setup may take several days. However, 3D data reduces ambiguity. Single 3D surveys often replace multiple 2D lines.
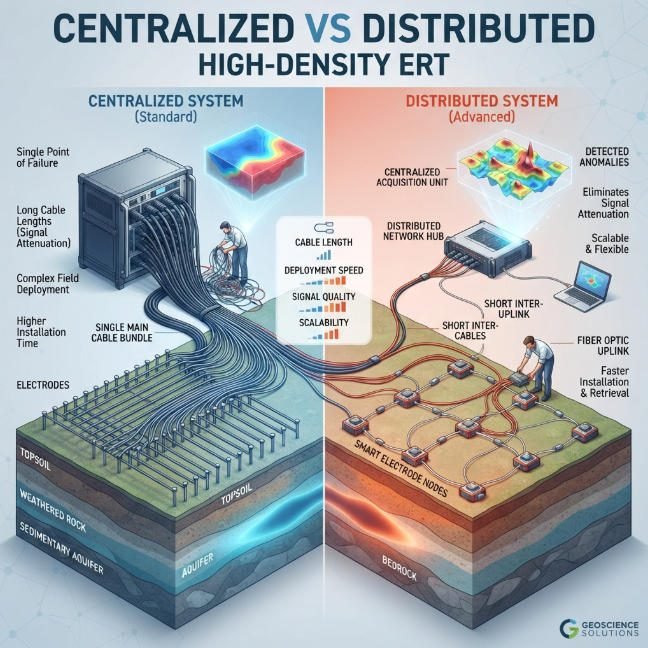
Modern high-density systems improve both approaches. Distributed electrode arrays speed deployment. Wireless nodes eliminate cable runs. Drone-assisted layout further accelerates fieldwork.
3. Depth Penetration and Investigation Range
Depth depends on electrode spacing and array geometry. 2D surveys typically reach 50 to 500 meters. Larger spacings extend depth but reduce resolution. Wenner arrays favor shallow investigation. Schlumberger configurations probe deeper.
3D surveys with hybrid arrays achieve greater depths. Surface-borehole combinations reach 2500 meters. Adaptive frequency methods optimize depth penetration. These capabilities suit deep mineral exploration.
4. Processing Complexity and Inversion Accuracy
2D inversion requires modest computing resources. Standard algorithms run on laptops. Processing completes in minutes. Results guide immediate field decisions.
3D inversion demands significant computation. Finite element models contain millions of cells. Iterative solvers require hours or days. Cloud computing accelerates this process. The investment yields more reliable geological models.
5. Cost Structure Analysis
2D surveys cost less per line. Simpler equipment reduces capital expense. Faster deployment lowers labor costs. However, multiple lines may be needed. Total project costs can exceed single 3D surveys.
3D surveys show higher initial costs. More electrodes increase hardware investment. Complex processing adds software expense. Yet comprehensive 3D data often eliminates follow-up surveys. Total project economics frequently favor 3D approaches.
Ⅲ. Electrode Array Configurations for Resistivity Surveys
Array geometry significantly affects data quality. Different configurations optimize specific targets.
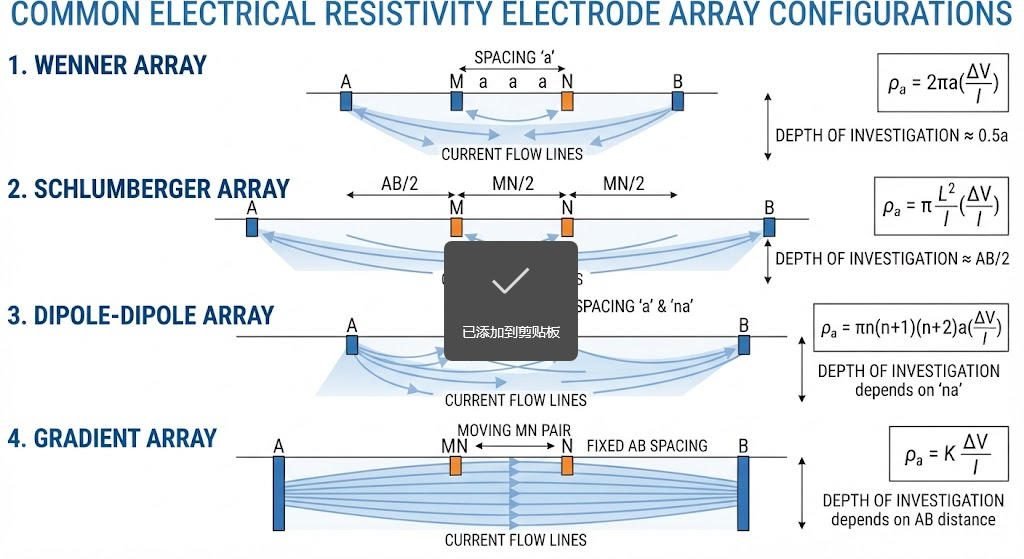
1. Wenner Array Characteristics
Wenner arrays use equal electrode spacing. Current and potential electrodes maintain fixed ratios. This geometry produces simple, smooth pseudosections. It works well for horizontal layering.
Vertical resolution remains moderate. Wenner arrays detect layer boundaries clearly. They struggle with steeply dipping structures. Signal strength decreases with depth. This array suits shallow engineering surveys.
2. Schlumberger Array Applications
Schlumberger arrays separate current and potential pairs. Potential electrodes remain fixed while current electrodes expand. This geometry probes deeper with less equipment movement.
Vertical resolution exceeds Wenner configurations. Schlumberger arrays suit depth sounding applications. They work well for groundwater exploration. Bedrock mapping benefits from this geometry.
3. Dipole-Dipole Array Advantages
Dipole-dipole arrays use closely spaced current pairs and potential pairs. Separation between pairs varies systematically. This geometry emphasizes lateral variations. It detects steeply dipping structures effectively.
Signal strength weakens rapidly with depth. Noise affects deep measurements more. However, shallow anomaly detection excels. Mineral exploration frequently uses this array.
4. Hybrid and Optimized Arrays
Modern surveys combine multiple configurations. Wenner data provide smooth background. Dipole-dipole data reveal lateral features. Combined inversion leverages both strengths.
Computer optimization designs custom arrays. Algorithms maximize target sensitivity. They minimize acquisition time. These advanced methods improve survey efficiency.
Ⅳ. Applications of Resistivity Imaging Systems
ERT serves diverse industries. Each application demands specific approaches.
1. Mineral Exploration and Mining
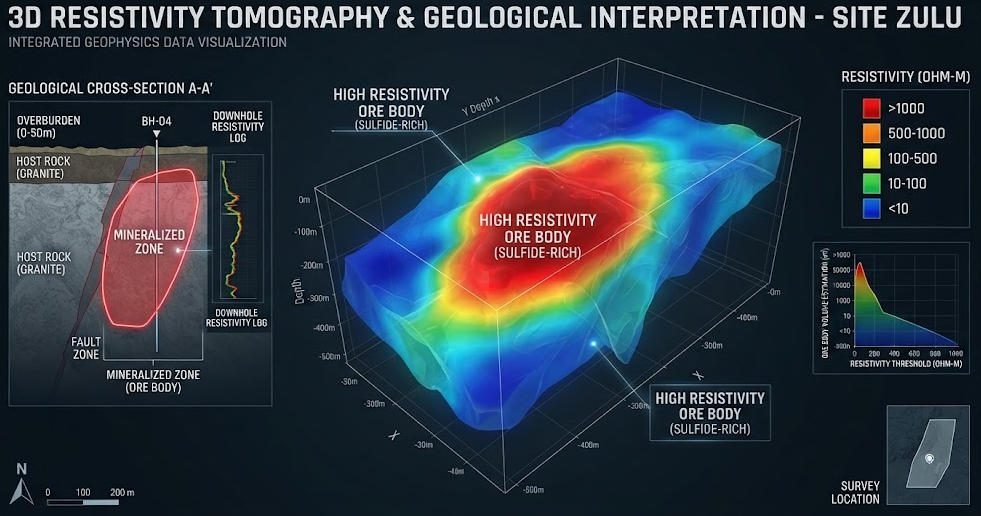
Ore bodies often show resistivity contrasts. Sulfide minerals conduct electricity well. Quartz veins resist current flow. These differences create detectable anomalies.
Gold exploration uses ERT to map alteration zones. Silicified rock shows high resistivity. Clay alteration displays low values. Geologists interpret these patterns to target drilling.
Deep ore body modeling requires 3D approaches. Surface-borehole hybrid arrays extend depth. Real-time monitoring tracks extraction progress. Resistivity imaging supports mine planning throughout project lifecycles.
2. Groundwater and Environmental Studies
Aquifers display characteristic signatures. Saturated zones show low resistivity. Confining layers appear as high-resistivity barriers. ERT maps these boundaries efficiently.
Contaminant plume tracking benefits from time-lapse monitoring. Leachate from landfills increases conductivity. Repeated surveys show plume migration. This information guides remediation strategies.
Saltwater intrusion mapping protects coastal aquifers. Freshwater shows higher resistivity than saline water. ERT delineates the interface. Managers use these data to optimize pumping.
3. Engineering and Infrastructure Assessment
Foundation studies require bedrock mapping. Weathered rock shows lower resistivity than fresh bedrock. ERT identifies suitable bearing depths. Engineers design foundations accordingly.
Tunnel investigations detect fracture zones. Water-filled fractures conduct electricity. Dry fractures appear resistive. Advance knowledge improves tunneling safety.
Dam integrity monitoring employs repeated surveys. Seepage paths show as anomalous conductive zones. Early detection prevents catastrophic failures. Regular monitoring ensures structural safety.
4. Geothermal and New Energy Development
Geothermal reservoirs show resistivity variations. Hot brines conduct electricity well. Altered host rocks display characteristic signatures. ERT maps reservoir boundaries.
Enhanced geothermal systems need fracture imaging. Stimulation creates conductive pathways. Time-lapse surveys monitor fracture growth. This information optimizes well placement.
Carbon capture projects use resistivity monitoring. CO2 injection changes pore fluid conductivity. Repeated surveys track plume migration. Regulatory compliance requires such documentation.
Ⅴ. Advanced Processing and Inversion Methods
Raw data require sophisticated processing. Modern algorithms extract maximum information.
1. Forward Modeling and Synthetic Data
Forward modeling predicts measured responses. Geologists propose subsurface models. Computers calculate expected data. Comparisons with field data test hypotheses.
Synthetic data train interpreters. Known models create test datasets. Processing algorithms must recover these models. Validation ensures reliable interpretation.
2. 2D Inversion Algorithms
Least-squares inversion minimizes data misfit. Smoothness constraints stabilize solutions. Regularization parameters balance data fit against model simplicity.
Robust inversion handles noisy data. Outliers affect results less. L1 norms replace L2 norms. These methods improve results in challenging conditions.
3. 3D Inversion Challenges
3D problems contain many more unknowns. Computational demands increase dramatically. Parallel processing distributes calculations. GPU acceleration speeds convergence.
Unstructured meshes adapt to complex geology. Tetrahedral elements follow topography. Refinement focuses on target zones. These advances improve model accuracy.
4. Time-Lapse Inversion
Repeated surveys monitor dynamic processes. Difference inversion highlights changes. Base models constrain time-lapse solutions. This approach detects subtle variations.
4D visualization shows temporal evolution. Animations reveal process dynamics. Managers make informed decisions. Applications include reservoir monitoring and remediation tracking.
Ⅵ. The Geotech Approach to Resistivity Imaging
Geotech develops integrated resistivity imaging solutions. Our systems address real-world challenges.
1. High-Density Acquisition Systems
Geotech RIS systems deploy up to 1024 channels. Expandable architectures suit diverse projects. Quantum electrode arrays achieve fine spatial sampling. Real-time edge computing enables field quality control.
Automated switching reduces acquisition time. Multi-channel parallel measurement speeds surveys. GPS integration records precise positions. These features improve field efficiency.
2. Multi-Modal Data Integration
Geotech software integrates multiple geophysical methods. Resistivity data combine with seismic and electromagnetic results. Joint inversion improves interpretation confidence. Multi-physics approaches reduce ambiguity.
AI-assisted processing accelerates interpretation. Neural networks identify anomaly patterns. Automated quality control reduces errors. These tools enhance productivity.
3. Industrial Applications Focus
Mineral exploration benefits from deep imaging capabilities. Urban safety applications require high resolution. Environmental monitoring demands repeatability. Geotech configures systems for each sector.
The DJF Series high-power DC IP system serves demanding applications. 5kW and 10kW options suit different depths. Induced polarization adds chargeability information. Combined resistivity-IP surveys improve ore discrimination.
Case studies demonstrate real-world performance. Western Australian gold mines use Geotech systems for fracture detection. Subway projects employ time-lapse monitoring. Geothermal developers map reservoir structures.
Ⅶ. Selecting the Right Resistivity Imaging System
Project requirements dictate system choice. Consider these factors carefully.
1. Define Survey Objectives
Clarify target characteristics. Depth, size, and resistivity contrast matter. Shallow targets suit 2D approaches. Complex geometries need 3D imaging. Quantitative requirements demand higher precision.
2. Evaluate Site Conditions
Terrain affects deployment. Flat ground simplifies cable laying. Rugged terrain requires distributed systems. Access restrictions limit equipment choices. Urban settings introduce cultural noise.
3. Balance Resolution Against Budget
Higher resolution costs more. Dense electrode arrays increase hardware expense. 3D processing requires software licenses. Determine acceptable resolution for project goals.
4. Plan for Data Processing
Field data need inversion and interpretation. Ensure adequate computing resources. Train personnel in software use. Budget for processing time. These elements affect project timelines.
Ⅷ. Future Trends in Resistivity Imaging
Technology continues advancing. Several trends shape future development.
1. Real-Time 3D Visualization
Field computers now display preliminary 3D models. Operators adjust surveys immediately. Quality control improves dramatically. Decision-making accelerates.
2. Drone-Based Deployment
Aerial platforms carry lightweight electrode arrays. Drone deployment accesses difficult terrain. Rapid coverage reduces field time. This approach expands survey possibilities.
3. Cloud and Edge Computing
Edge devices preprocess data in the field. Cloud platforms run complex inversions. Results return within hours. This hybrid approach balances speed and accuracy.
4. AI-Driven Interpretation
Machine learning automates anomaly detection. Training datasets improve with each project. Interpretation consistency increases. Less experienced users achieve reliable results.
Ⅸ. Conclusion
Resistivity imaging systems provide essential capabilities for subsurface exploration. Electrical resistivity tomography maps geology without excavation. 2D approaches offer efficiency for linear targets. 3D methods reveal complex structures with unprecedented detail.
High-density resistivity methods continue improving. Multi-channel acquisition speeds surveys. Advanced inversion algorithms enhance accuracy. Integration with other geophysical methods strengthens interpretation.
Geotech delivers resistivity imaging solutions for diverse applications. From mineral exploration to environmental monitoring, our systems provide reliable results. Contact our team to discuss your project requirements.
Investing in proper resistivity imaging technology pays dividends. Accurate subsurface models reduce drilling costs. They improve project success rates. They support sustainable resource development.
Reference Sources
| Organization | URL |
|---|---|
| Society of Exploration Geophysicists (SEG) | https://seg.org/ |
| Environmental and Engineering Geophysical Society (EEGS) | https://www.eegs.org/ |
| International Association of Hydrogeologists (IAH) | https://iah.org/ |
| US Geological Survey (USGS) – Geophysics | https://www.usgs.gov/programs/earthquake-hazards/geophysics |
| European Association of Geoscientists & Engineers (EAGE) | https://www.eage.org/ |
FAQ
Q1: What are resistivity imaging systems used for?
A1: Resistivity imaging systems map underground electrical properties for geophysical surveys. They detect ore bodies in mineral exploration. They locate groundwater aquifers. They assess contamination plumes. They evaluate infrastructure integrity. Electrical resistivity tomography serves diverse industries.
Q2: What is the difference between 2D and 3D ERT?
A2: 2D ERT creates cross-sectional profiles along a single line. It suits linear targets like pipelines. 3D ERT produces volumetric models from area arrays. It maps complex structures like ore bodies. 3D surveys offer higher resolution but require more complex deployment.
Q3: How deep can resistivity imaging systems investigate?
A3: Investigation depth depends on electrode spacing and array geometry. 2D surveys typically reach 50 to 500 meters. 3D surveys with hybrid arrays can extend to 2500 meters. Larger spacings increase depth but reduce resolution.
Q4: What electrode array works best for mineral exploration?
A4: Dipole-dipole arrays excel at detecting steeply dipping structures common in mineral deposits. Wenner arrays suit horizontal layering. Schlumberger configurations favor depth sounding. Modern surveys often combine multiple arrays for comprehensive coverage.
Q5: How does high-density resistivity method improve surveys?
A5: High-density resistivity method uses automated switching with hundreds of electrodes. Dense spatial sampling improves resolution. Multi-channel acquisition speeds data collection. Tomographic inversion produces detailed subsurface images. These advances enable practical 3D surveys.