Welcome to Geotech!

Application of High – Precision Magnetic Survey in Mineral Exploration
Description
Mineral resource exploration and development rely heavily on geophysical exploration methods, with electromagnetic sounding and high – precision magnetic survey being two key techniques widely used in mineral exploration. This paper explores their application effects in a specific area, focusing on geological mapping, ore – body detection, and mineral – prospecting prediction, providing valuable technical references for future mineral exploration.
Geological Background
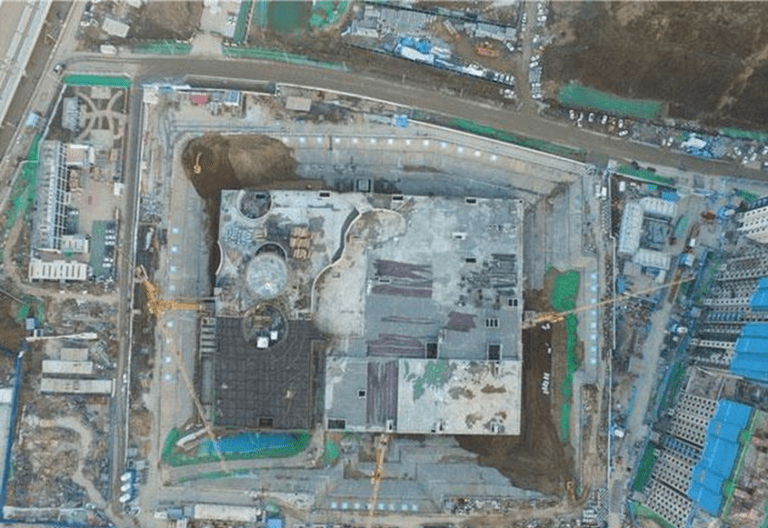
The study area is located in the northwest of Kunming. It is part of the Wuding – Yuanjiang rift – graben in the southern segment of the Kangdian geosyncline. Geological data from a 1:200,000 scale shows that the fold basement, mainly from the Middle and Lower Proterozoic, is distributed along the Lujin River fault on the east side of the survey area. It is bounded by the Yuanmou – Lujin River fault and the Pudu River fault and forms a continuous rift – graben with a series of tectonic fragments, thrust faults, mylonite zones, and various folds. The main rock types are slate, phyllite, schist, dolomite interbedded with crystalline limestone, basic volcanic breccia, etc. Lead – zinc ore is exposed in the Yinmin Group and Luoxue Group strata and is controlled by fault structures. Severe stratum coverage exists in the area.
Geophysical Characteristics
Geological survey statistics show that magnetic iron ore has the strongest magnetism. Basic rocks and weathered laterite have some magnetic variation, while other strata are non – magnetic or weakly magnetic. Magnetic anomalies, after excluding the influence of basic rocks and weathered laterite, are generally related to magnetic iron ore. The lead – zinc and magnetic iron ores have high polarizability and low resistivity. Other rocks have a view amplitude frequency of less than 3% and a view resistivity of less than 250Ω・m, meeting the requirements for electrical methods. Due to severe stratum coverage, geophysical methods are crucial for geological mapping.
Methods and Purposes
Magnetic exploration, a geophysical method, studies geological structures and ore – body distribution by observing rock magnetic differences and field characteristics. It is widely used in mineral exploration for its simplicity and efficiency. This project aims to conduct 1:10,000 high – precision magnetic surveys around known mines to define strata, fault boundaries, and magnetic anomalies. This will support geological mapping in covered areas and identify promising mineral – prospecting zones. Electromagnetic sounding will also be used to profile magnetic anomaly areas, investigating ore – body attitudes, widths, and extensions.
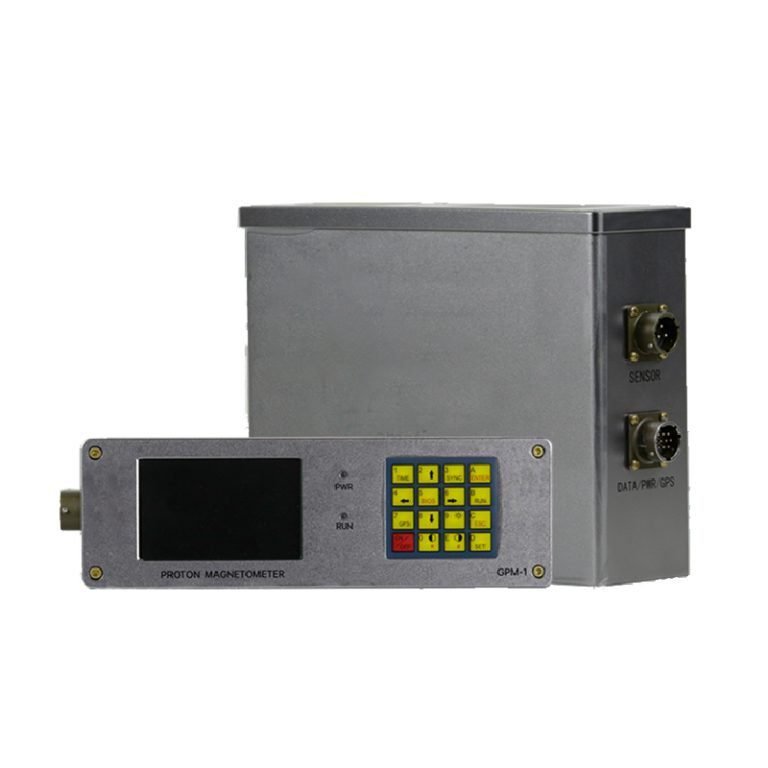
The magnetic survey used Geotech’s JPMG proton magnetometer and was equipped with a GPS positioning system. The data was corrected for diurnal variation, elevation, latitude and base point to obtain magnetic anomaly values. Magnetotelluric (MT) surveys were conducted at significant anomaly points, and 1:2,000 magnetic profile surveys were conducted. The MT survey used Geotech’s GSEM-W10 electromagnetic imaging system with a point spacing of 50 meters.


Data Processing and Results
Magnetic Data Processing and Results
Field data was collected in a regular grid pattern. To ensure data accuracy, points affected by highway, substation, and power line interference were checked and corrected by comparing with nearby points.
Corrected data underwent daily variation, height, and latitude corrections to get ΔT magnetic anomaly values. These values were matched to actual measurement points, and RGIS2010 software was used to create profile plane maps. The maps revealed a positive magnetic anomaly in the northern part of the survey area with good continuity across four profiles, indicating reliability. The profile plane maps also showed distinct magnetic anomaly zones with obvious positive and negative magnetic anomaly bands between zones, reflecting geological body boundaries.
Surfer software gridded the ΔT magnetic anomaly data to create a ΔT contour map. The map showed a positive magnetic anomaly in the north, elliptical in shape, trending east – west. The anomaly had a southwest – side weak negative anomaly, covered an area of 0.4 km², and had a maximum value of 800nT. It matched well with the exposed Kunyang Group Yinmin Group fine – sandy slate, purple – grey breccia, and magnetic iron – bearing breccia in the geological map and was near a fault. The anomaly showed deep – source characteristics and remained detectable at 400m depth with a 20nT anomaly. In the eastern part of the survey area, a positive magnetic anomaly with a belt – like planform trending east – west was found, with negative anomalies on both north and south sides.
Considering all mapping results, we identified the main features for fault inference and anomaly definition. Based on magnetic anomaly characteristics and geological data, three faults and five magnetic anomaly zones were defined. The inferred faults matched well with geological mapping results, proving the effectiveness of magnetics in geological mapping of covered areas. For example, the No.3 magnetic anomaly had a belt – like planform trending nearly east – west, with a strong negative anomaly on the south side. The positive anomaly covered an area of 1.1 km² and had a maximum value of 560nT. It corresponded to the exposed Kunyang Group Yinmin Group (Pt2y), composed of fine – sandy slate and lower purple – grey breccia, the main ore – bearing strata. The anomaly boundary was crossed by the F1 fault, whose attitude matched the gradient zone of the anomaly. The anomaly also showed deep – source characteristics and remained detectable at 400m depth with a 25nT anomaly. It was inferred to be caused by an ore – bearing body controlled by fault structures. As the No.3 anomaly area included a known lead – zinc ore point, detailed MT surveys were planned for further examination.
MT Data Processing and Results
MT data was preprocessed and statically corrected, followed by Occam2D inversion to generate 2D profile data files. Surfer software was used to create 2D apparent resistivity contour maps. The profile, perpendicular to the No.3 magnetic anomaly and crossing the F1 fault between the Yinmin Group and Lujin River Group, was analyzed with geological data. Points 1 – 9 corresponded to clastic rocks of the Yinmin Group, and points 10 – 20 corresponded to dolomites of the Lujin River Group. The MT inversion results showed:
- At points 4 – 8 (elevation 2050 – 1400m), a low – resistance anomaly was found, inferred to be a fault fracture zone. Due to possible water – filling or ore – bearing in the fault fracture zone, it showed a low – resistance anomaly, matching the geological fault position. The fault had a dip angle of about 75° and a northeasterly dip direction.
- At points 1 – 3 (elevation 2050 – 1600m), a relatively high – resistance anomaly was found, inferred to be intact clastic rocks of the Yinmin Group.
- At points 9 – 20 (surface elevation 2050 – 1950m), a relatively low – resistance anomaly was found, inferred to be a shallow groundwater layer.
- At points 9 – 20 (middle elevation 1950 – 1400m), a relatively high – resistance anomaly was found, inferred to be dolomites of the Lujin River Group. Local low – resistance anomalies might be due to incomplete dolomites.
- At points 6 – 20 (bottom elevation 1400 – 1000m), a high – resistance anomaly was found, inferred to be the basal layer of the Lujin River Group. The dense rock showed high – resistance characteristics.
Based on geological and MT data, a geological – geophysical model was established. RGIS2010 software was used for 2.5D interactive inversion and quantitative fitting of ΔT magnetic anomalies. Magnetic parameters were set as: magnetic inclination 38.5°, magnetic declination – 1°, and magnetization intensity 0.87A/m. The magnetic anomaly fitting root – mean – square error was 22.43, indicating a good curve fit and reasonable model design. The ore – body was calculated to be about 80m wide, 300m deep, 100m thick, and dipping to the northwest. Further geological group verification was recommended.
Conclusions
In the mineral survey of this working area, geophysical methods like high – precision magnetics and electromagnetic sounding have achieved significant results:
- Three fractures were inferred from magnetic results, offering reliable references for fracture mapping in covered areas. Their locations and trends align well with geological data, proving the effectiveness of magnetics in stratigraphic division and geological mapping of covered areas.
- After processing, the magnetic survey data were used to generate various maps to assist in anomaly screening and interpretation. Five magnetic survey anomalies were identified, which improved the reliability of fault inference and anomaly delineation, and provided a key basis for finding promising mineral exploration areas.
- The electromagnetic sounding method effectively determined the attitudes and extensions of fracture structures and detailed stratigraphic electrical differences.
- An integrated geological – geophysical model was built using geological and electromagnetic sounding data. Constrained inversion of magnetic profile data improved inversion accuracy and reduced ambiguity in geophysical anomaly interpretation.
- By quantitatively inverting magnetic profiles to calculate deep ore body characteristics and identify potential hidden blind ore bodies, more accurate and comprehensive geological information can be provided for mineral exploration and development, which is conducive to improving exploration efficiency and the economic benefits of resource utilization.
FAQ
What is the main difference between a single tap and a double tap?
What is the principle of high-density electrical prospecting?
What are the advantages of high-density electrical method?
In what fields is the high-density electrical method generally used?
What are the application characteristics of high-density electrical method?