Welcome to Geotech!
Radar solution: Highway subsurface cavity detection solution
Description
Ⅰ. Overview
Due to the excavation of underground pipelines, a road area has sunk in the construction area and a landslide has occurred. Originally, a detailed two-dimensional resistivity imaging geophysical survey method could be used to understand the characteristics of the changes in the foundation soil layer on the road surface. However, because the asphalt layer is too thick for the drill to penetrate, the resistivity imaging geophysical survey method cannot be used for investigation. The measurement data collected only on the road island for comparison showed that the soil layer under the road was discontinuous. Based on the abnormal changes in imaging, the resistivity is obviously much higher than the original foundation soil. Therefore, in the case of a repaired road, we can use depth sensing radar or GPR technology to test the road surface condition and then determine the underground condition.
II. Project Objectives
To understand the road surface base condition and study the changes in the road base using ground penetrating radar (GPR) survey.
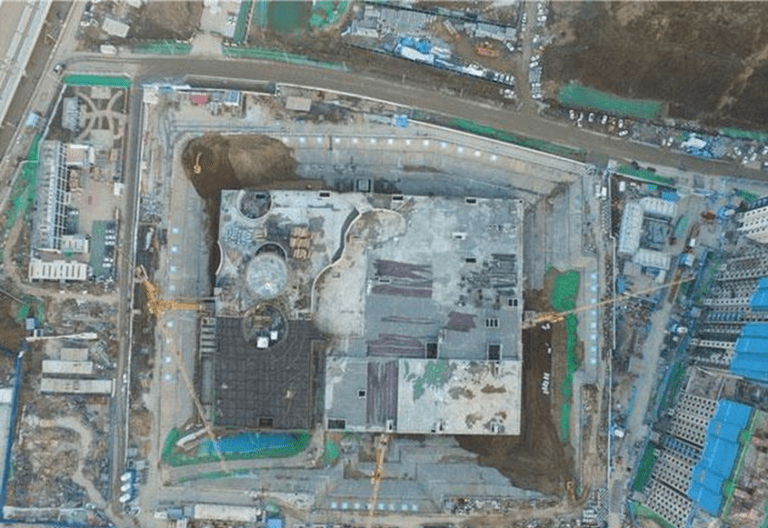
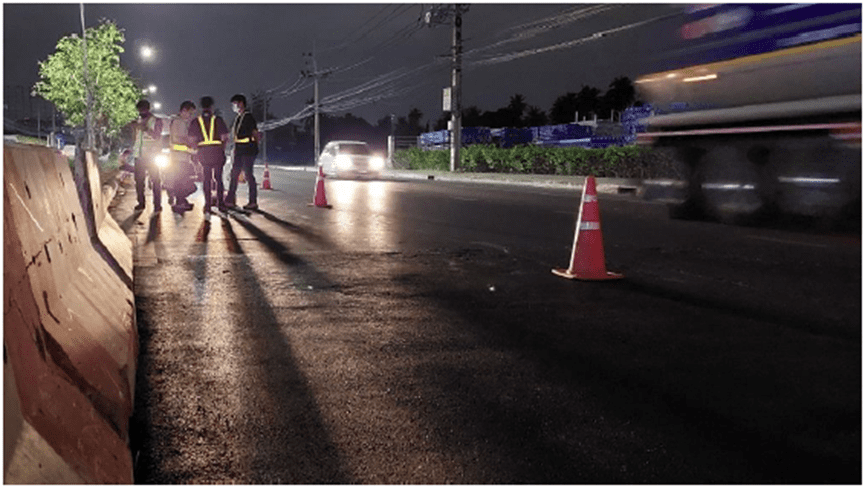
III. Location of measurement area and measurement line
The measurement line length of the middle lane on both sides of the road is about 40 meters. The location of the measurement line is shown in Figure 1.


IV. Ground Penetrating Radar (GPR) Survey Principle
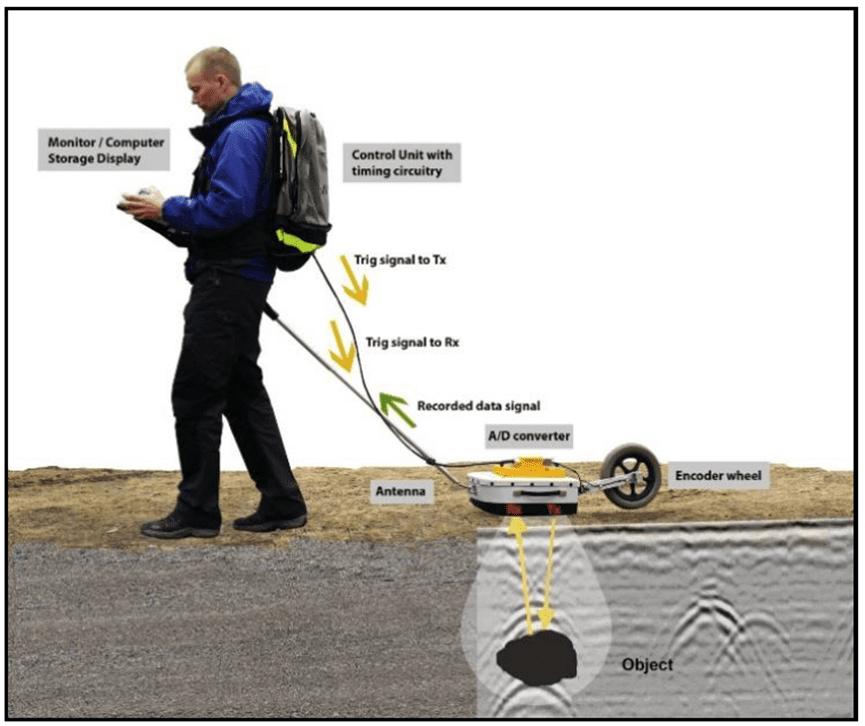
Ground Penetrating Radar (GPR) is a non-invasive technology used to detect underground structures. Its basic principle is to use the propagation characteristics of electromagnetic waves in underground media to obtain underground information. GPR generates images or cross-sections of underground structures by emitting high-frequency electromagnetic waves and receiving reflected signals. (As shown in Figure 3).
Ⅴ. GPR survey work
Survey tools
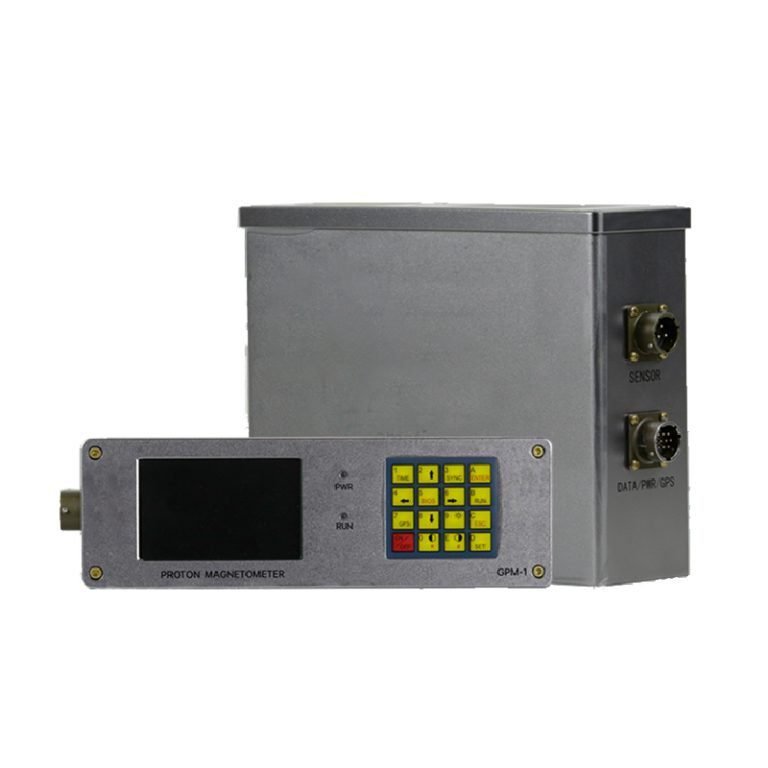
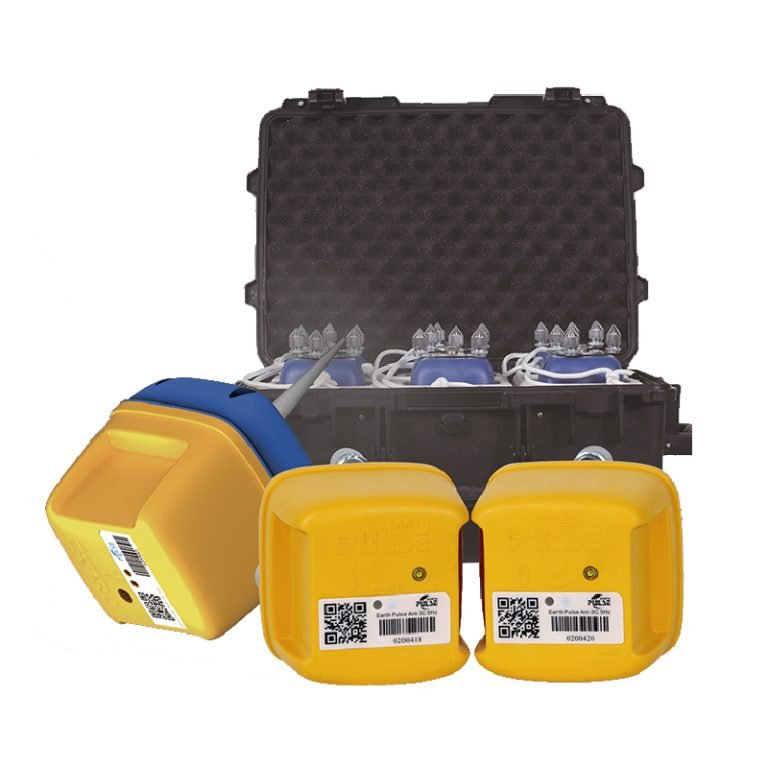
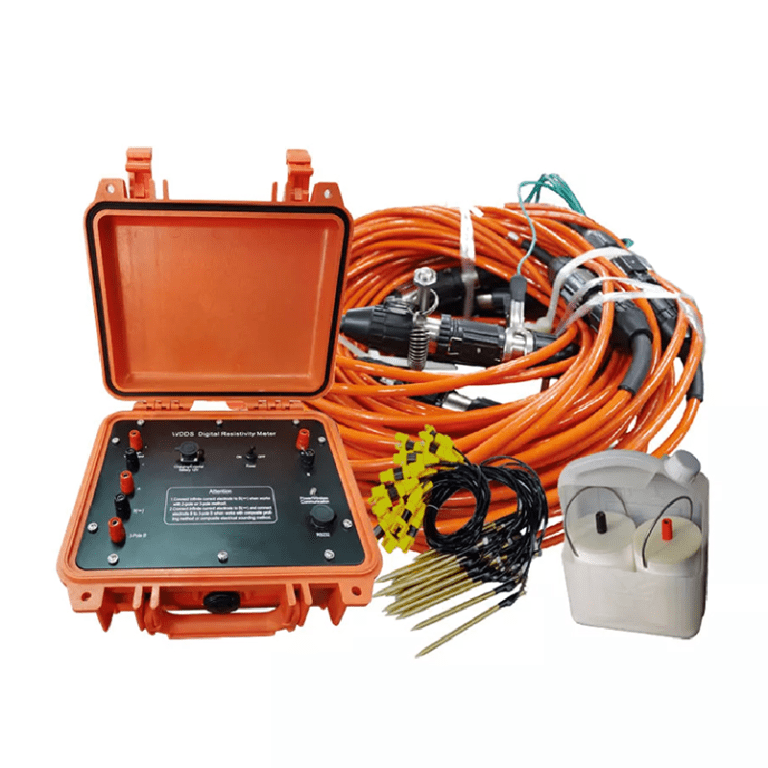
1. The radar depth meter is Geotech’s Geopro T-Series 2D Ground Penetrating Radar (GPR), which is connected to the transmitter (antenna) via a cable and sent back to the control and processing section (as shown in Figure 4).
2. Software for processing and analyzing data: Reflex version 5.0
Determine the survey line and site conditions. The survey lines are shown in Figure 5. There are a total of 6 survey lines, each 40 meters long, covering 2 inner lanes on both sides, consisting of survey lines LINE R1 R2 R3 (R-Side) and survey lines LINE L1 L2 L3 (L-Side) (as shown in Figure 5). The condition of this area is the inner lane of the road. Left and right sides (as shown in Figure 6)
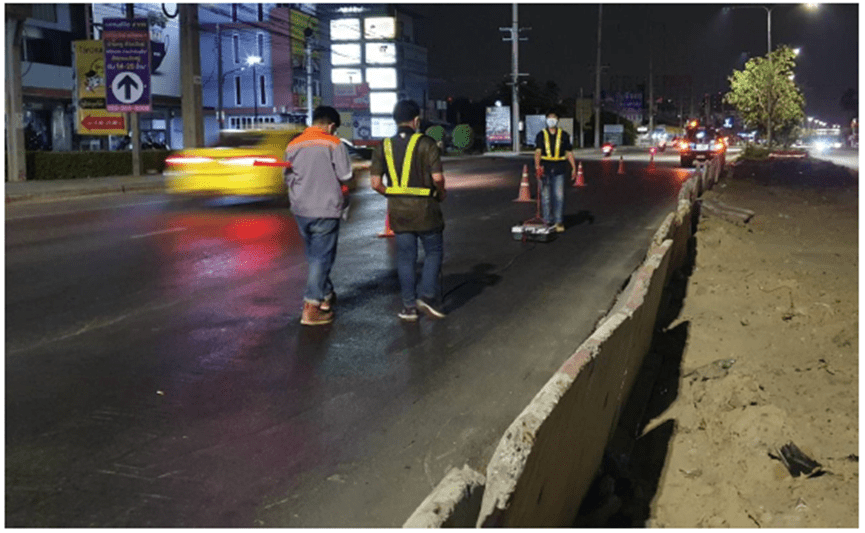
Field work
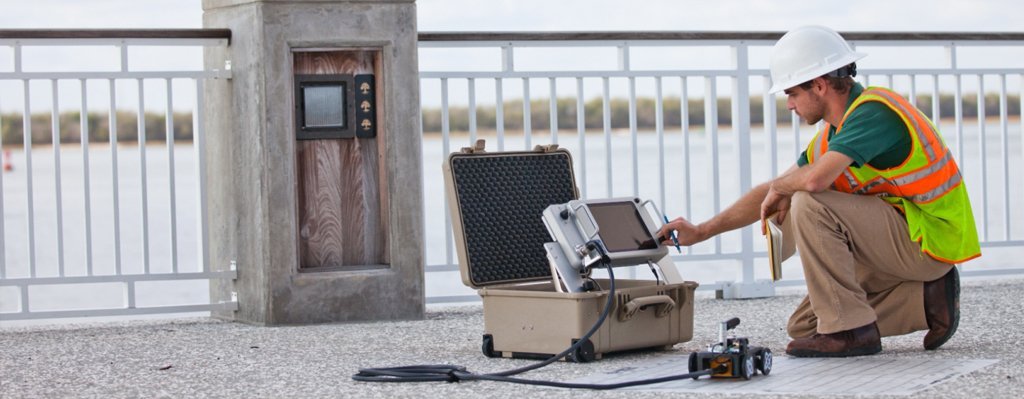
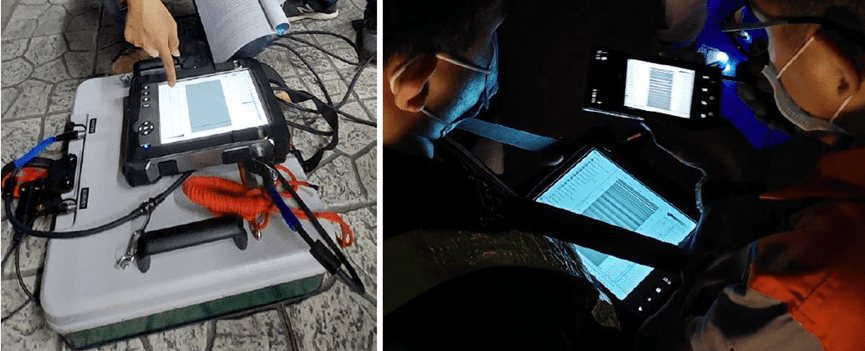
The instrument is calibrated according to the measurement distance. As the wheel moves the device relative to the distance, the position data is acquired and the transceiver is moved at a constant speed. Continuous data is acquired along the measurement line (as shown in Figure 7). The acquired data is displayed, processed and stored in the GeoPro2 device.


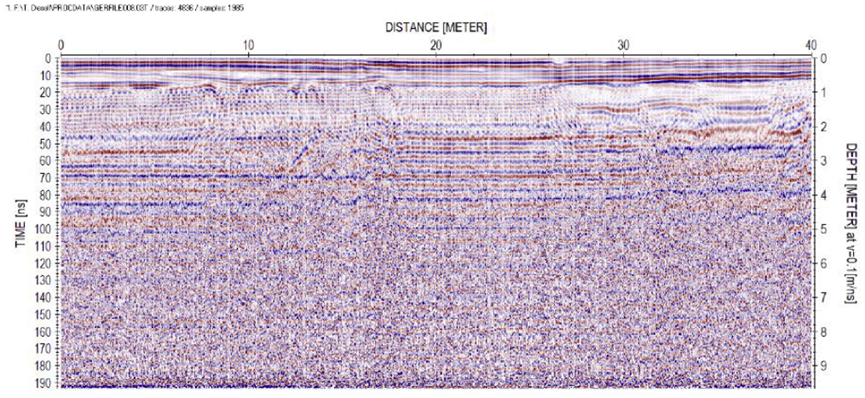
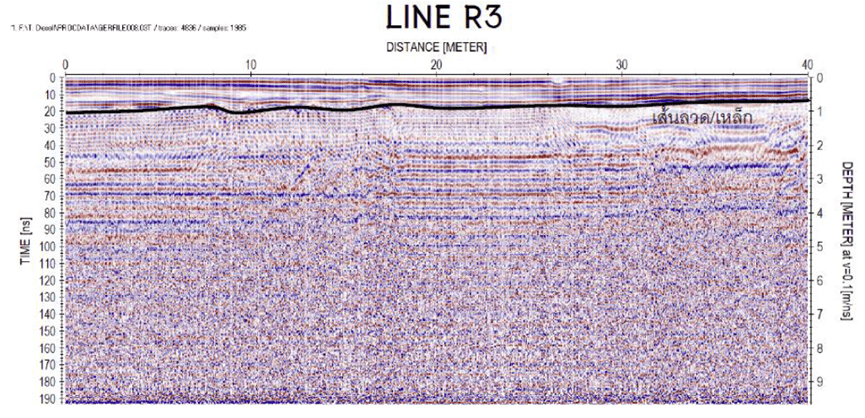
VI. Survey Results
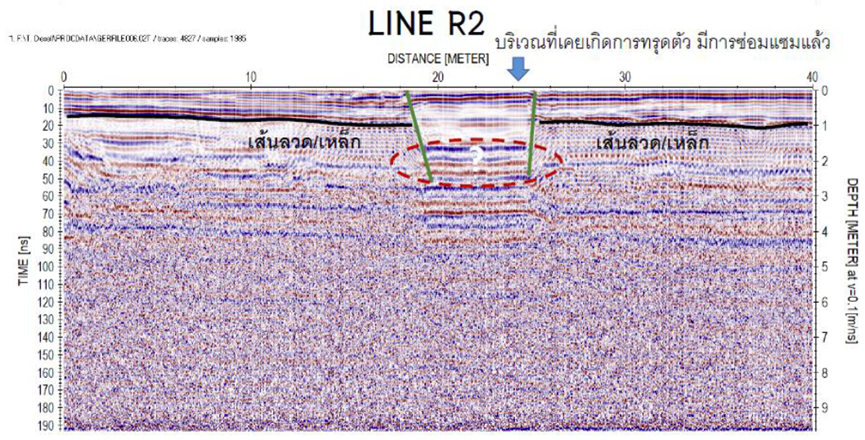
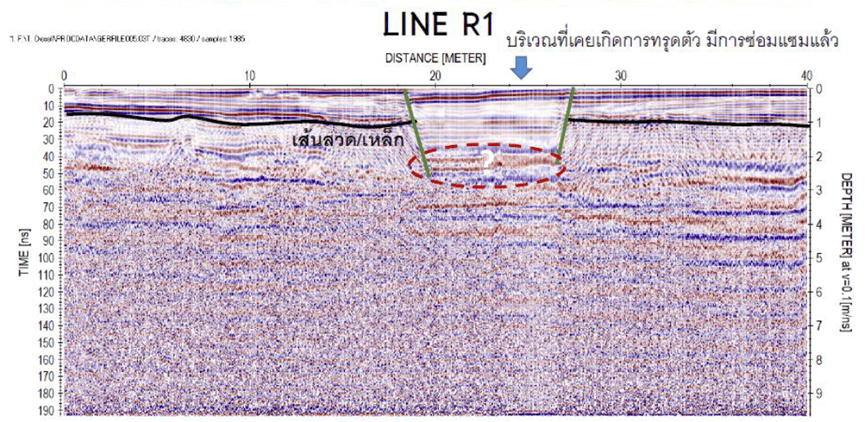
The GPR results show the changes in the soil layer under the road surface. At a depth of about 2.5 meters, there are steel bars reinforced in the concrete layer to support the asphalt layers of different thicknesses. The survey results are presented in the form of lines from southeast to northwest (right → left).
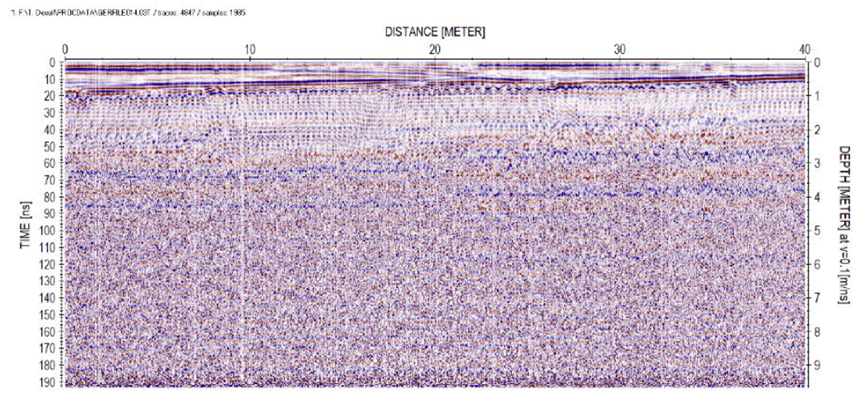
For the right lane R-SIDE, survey line LINE R3, and the outer edge of the lane, no obvious soil changes were found (Figure 8). As for LINE R2, the middle lane line and LINE R1, the inner edge line near the center island (Figures 9 and 10), a compacted soil area of about 7 meters long was found, and the GPR signal did not clearly show that it was an air cavity.
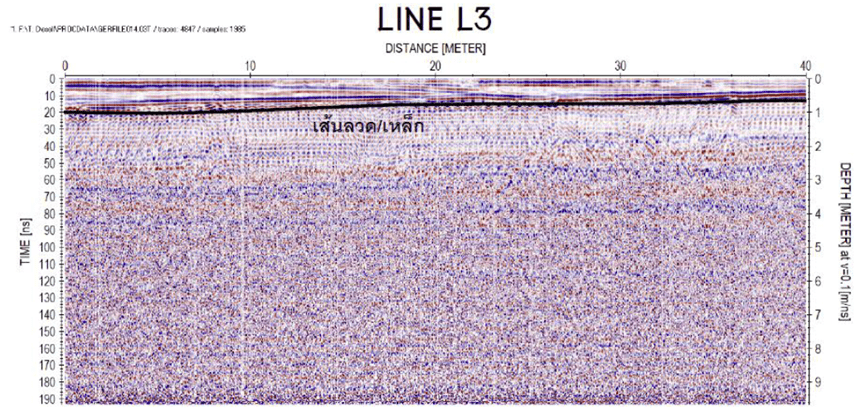
The left lane L-SIDE is similar to the right lane, that is, LINE L1 at the inner edge and LINE L2 in the middle of the lane (Figures 11 and 12) are in the compacted soil area, about 6 meters long, and far from the GPR signal. It is not clear whether there are air pockets in this area. For the outer lane edge survey line LINE L3, no obvious soil changes were found (Figure 13).
Figure 14 shows the survey results of all 6 survey lines. Figure 15 shows areas where the soil compaction differs from the normal situation.


VII. Conclusion
GPR radar depth survey was used to find the changes in the soil layers that constitute the foundation surface.
The GPR measurement results show the changes in the soil layers under the road surface. At a depth of about 2.5 meters, there are reinforced concrete layers on the left and right sides. Abnormal signals were detected in asphalt layers of different thicknesses, and a soil compaction area in the middle of the inner lane was estimated to be about 6-7 meters long. From the GPR signal, it is not clear whether there are air holes in this area. For the survey line, there is no obvious soil change at the edge of the outer line away from the center island.
FAQ
What is the main difference between a single tap and a double tap?
What is the principle of high-density electrical prospecting?
What are the advantages of high-density electrical method?
In what fields is the high-density electrical method generally used?
What are the application characteristics of high-density electrical method?