Welcome to Geotech!

Application of Electrical Resistivity Tomography (ERT) in Efficient Detection of Abandoned Mining Tunnels Beneath Expressways
Description
Abstract
The settlement and deformation of abandonedmining tunnels can lead to cracking, deformation, or even the collapse of surface structures. Recently, a dual-direction, four-lane expressway, designed a speed of 100 km/h, is planned to be constructed between Yuanling County and Chenxi County. This expressway will pass through a long-abandoned refractory clay mining area in Chenxi County. This study focuses on this abandoned mining area and employs the Electrical Resistivity Tomography (ERT) method to investigate the underground conditions, aiming to determine the location and scale of the subterranean goaf. A total of five survey lines were deployed for the investigation. The inversion results indicate the presence of five low-resistivity anomalies in the underground structure (with six low-resistivity anomalies identified along line L1). These low-resistivity anomalies are preliminarily interpreted as subsurface cavities. Subsequent borehole verification revealed that the five low-resistivity anomalies correspond to a total of eight water-filled cavities, including six abandonedmining tunnels and two karst caves. At the location K33+260~K33+350, a large low-resistivity anomaly was identified which actually consisted of three closely spaced water-filled abandonedmining tunnels. Additionally, the surrounding strata primarily consisted of fractured mudstone, which has a high water content and thus exhibits low resistivity. These two factors combined resulted in the three water-filled abandonedmining tunnels appearing as a single large low-resistivity anomaly in the inversion profile. Meanwhile, at K33+50~K33+110, two water-filled abandoned mining tunnels were found. These tunnels are far apart along line L1 but are relatively close to each other on the other four survey lines. Consequently, in the inversion results, line L1 displays these as two separate low-resistivity anomalies, while the other four survey lines show themas a single large low-resistivity anomaly. Based on the 2D inversion results, a 3Dmodel of the study area was constructed. This model provides a more intuitive visualization of the underground cavity structures in the study area. The findings not only serve as a reference for the subsequent remediation of the goaf area but also offer new insights into the detection of abandonedmining tunnels.
Keywords: abandoned mining; geophysics; ERT; expressway
1. Introduction
Underground voids are sometimes attributable to natural phenomena, such as karst processes and the dissolution of permafrost. Karstification results from the gradual dissolu-tion of carbonate rocks, while the dissolution of permafrost is driven by climate change, which accelerates the melting of frozen ground. In addition, human activities can create underground voids, such as old mine shafts or abandoned tunnels. The area of underground voids left behind after mining operations are completed is commonly referred to as an abandoned mining tunnel area.
By the end of 2025, the total length of expressways in China had reached 183,600 km, making it the longest expressway network in the world. With the rapid development of expressways, numerous cases have arisen where they must traverse mining areas. The residual mining tunnels in these mining areas have a significant impact on the stability of the expressway infrastructure. When an expressway crosses an abandoned mining tunnel area, the voids disrupt the initial stress balance of the overlying rock layers. The weight of the overlying rock mass may cause uneven surface deformation, which can damage both the roadbed and the pavement. Furthermore, most abandoned mining tunnels are filled with water, and, under the influence of water disturbance, surface subsidence in these areas may further develop, leading to catastrophic consequences. Therefore, conducting thorough surveys of abandoned mining tunnel areas in mining regions before the construction of expressways becomes crucial .
Various non-destructive geophysical methods are available for detecting underground abandoned mining tunnels. The fundamental principles of these methods are based on the differences in physical properties between the voids and the surrounding rock.
Depending on factors such as backfilling status and groundwater table fluctuations, abandoned mining tunnels may be empty, partially filled, fully filled, or completely water-filled. While geophysical methods have been shown to be effective in locating buried objects, their spatial resolution decreases with increasing depth. Therefore, applying these methods for detecting underground abandonedmining tunnels still presents significant challenges.
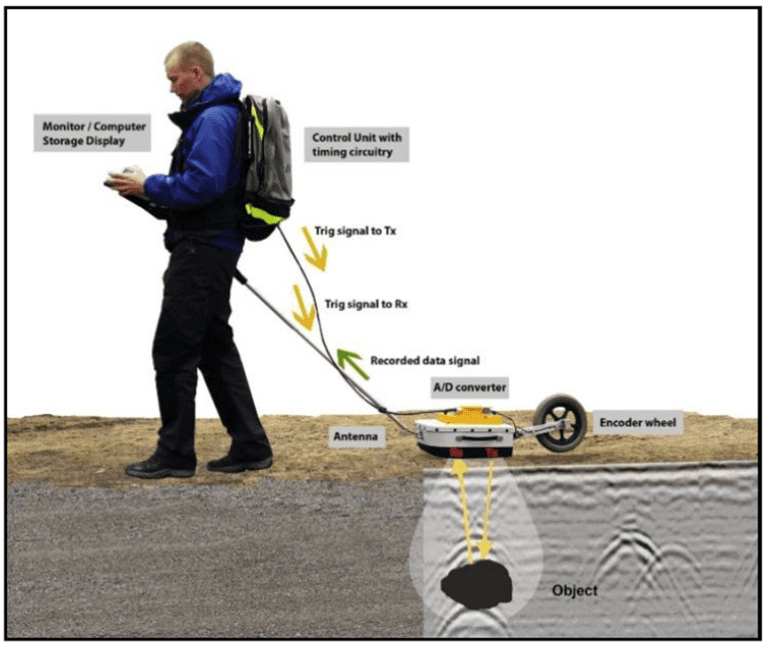
Currently, the primary geophysicalmethods for detecting underground abandonedmining tunnels include Ground-Penetrating Radar (GPR), seismic methods, gravity surveys, and Electrical Resistivity Tomography (ERT). Ground-Penetrating Radar is particularly effective for detecting shallow voids at depths of just a few meters. Due to its wide highfrequency range, GPR provides high-resolution images and can detect even small voids within concrete structures. As a result, GPR iswidely used for identifying voids in infrastructure.
Othermethods, such as seismic surveys, gravity surveys, and ERT, are also commonly applied. Among these geophysical techniques, ERT has been confirmed as a highly effective method for detecting underground voids. In recent years, due to its low cost, simple automated data collection, and efficient data acquisition, ERT has gained increasing popularity in civil engineering,mining operations, and underground void detection, as it can reliably reflect the underground characteristics.
This study focuses on the abandoned refractory clay mine located on the eastern side of Chenxi County. By utilizing ERT in combination with borehole data, the study analyzes the resistivity parameters of the strata to determine the distribution of the underground abandoned mining tunnels in the mining area. The findings provide valuable insight into the next steps in handling the abandoned mining tunnels and ensure the smooth progress of the Chenxi–Yuanling Expressway project. Furthermore, the research on the underground abandoned mining tunnels in the abandoned mining area offers valuable guidance for similar studies.
2. Study Area
Recently, a dual-direction, four-lane expressway, designed for speeds of 100 km/h, is planned to be constructed between Yuanling County and Chenxi County. This expressway will pass through a long-abandoned refractory clay mining area in Chenxi County. The mine is located to the east of Chenxi County in Huaihua City, Hunan Province. Themine is situated near the Yuanjiang River, approximately 1.2 km upstream from the Second Bridge of Yuanjiang River, to the north of the county seat (Figure 1). The Yuan-Chen Expressway spans themining area fromK32+580 to K33+440, covering a length of approximately 860m.

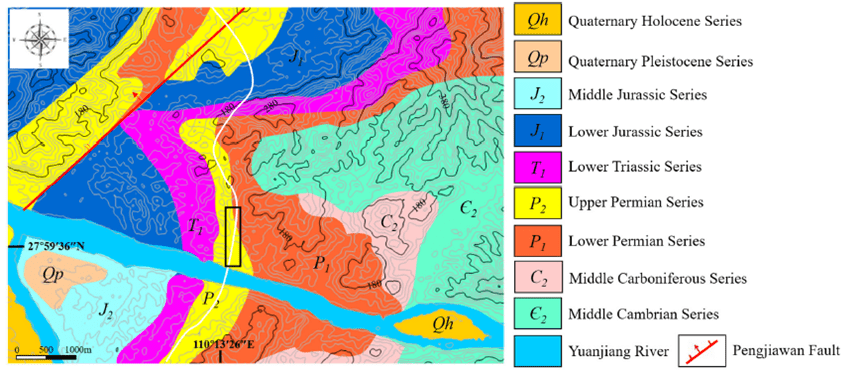
Based on the collected data, it can be confirmed that the terrain of the study area is predominantly hilly. The region experiences a subtropical monsoon humid climate with abundant rainfall, with an annual precipitation of approximately 1300 mm. The highest elevation is 200 m, while the lowest is 120 m, resulting in a relative elevation difference of 80 m. The study area is located on the southeastern edge of the Northwestern Hunan block, with the main fault being the Pengjiawan Fault, which strikes northeast (Figure 2).
Before conducting the ERT field survey, the relevant personnel carried out an engineering geological investigation of the study area and performed borehole exploration at the site. Based on the collected data, an engineering geological map of the study area was created (Figure 3). Figure 3 indicates that the exposed strata in the study area consist, in sequence, of Quaternary silty clay, Permian quartz sandstone, mudstone and sandy shale, and Carboniferous limestone. The refractory clay mine is located within the mudstone strata and is associated with the overlying quartz sandstone and the underlying sandy shale.
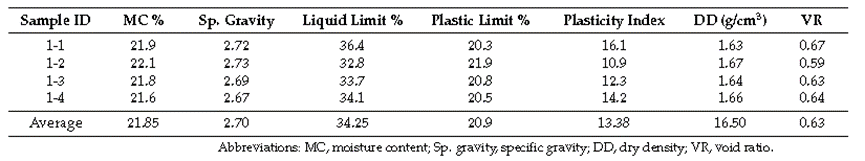
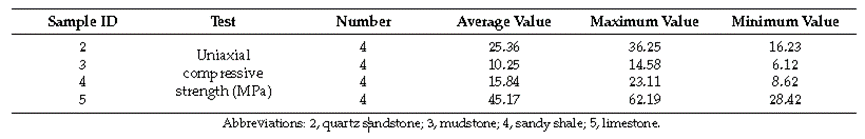
Laboratory tests on drill samples reveal that the Permian quartz sandstone, mudstone, and sandy shale are fragmented with poor physical and mechanical properties, while the Carboniferous limestone is intact and exhibits strong mechanical properties (Tables 1 and 2).
The tests also show that the Permian quartz sandstone, mudstone, and sandy shale have low uniaxial compressive strength due to their fragility. The presence of underground abandoned mining tunnels suggests that the expressway foundation may encounter insufficient bearing capacity in this area. Figure 2. Geological map of the study area. White line: expressway planning route. Black rectangle: study area.

Between K32+580 and K32+900 m, the refractory clay mine is relatively shallow, with open-pit mining as the primary method, supplemented by tunnel mining (ZONE-1 in Figure 1).From K32+900 to K33+440 m, tunnel mining serves as the primary extraction method (ZONE-2 in Figure 1). The mine, operational since the 1990s, has primarily been mined by private enterprises and local residents. Mining activities gradually ceased after 2015, but illegalmining continued even after the official cessation, resulting in a more complex network of internal passages. As mentioned earlier, the study area experiences abundant rainfall, and a large amount of precipitation causes the abandoned tunnels to fill with rainwater. The presence of water further decreases the stability of the abandonedmining tu
3. Methodology & Equipment
3.1 Principle method
Electrical Resistivity Tomography (ERT) technology is based on the conductive theory of porous media. This method involves injecting direct current (DC) into the ground through two electrodes (current electrodes) and measuring the potential drop between two other electrodes (potential electrodes) at different locations to calculate the subsurface resistivity distribution . The apparent resistivity (ρa) is then calculated using the aforementioned measured values (I, ΔV) and a geometric factor (K) related to the electrode configuration (Equation (1)).
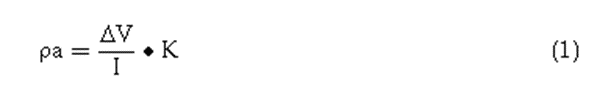
The apparent resistivity (ρa, measured in ohm-meters, Ω·m) is determined by the transmitted current (I, measured in amperes, A), the measured potential difference caused by the current (ΔV, measured in volts, V), and the geometric factor (K, measured in meters, m).
Measurements can be conducted along a line (two-dimensional subsurface geometry) or a grid (three-dimensional subsurface geometry). Several electrode arrays are widely used for various purposes, such as Wenner, Schlumberger, dipole–dipole, and multiple gradient pole–dipole configurations. The Schlumberger array offers higher spatial resolution for both horizontal and vertical variations in resistivity. For the dipole–dipole array, the Depth of Investigation (DOI) depends on the distance between the current dipole and the potential dipole, whereas, for the Schlumberger array, it depends solely on the length of the current dipole. For the dipole–dipole and Schlumberger arrays (where L is the profile length), the DOI is approximately 0.2 L and 0.12 L, respectively. The DOI is also influenced by the level of ambient electrical noise. High noise levels can reduce the signal-to-noise ratio. In this experiment, a Wenner electrode array is selected for detection because a Wenner array can better depict horizontal characteristics and is more conducive to identifying the scale and characteristics of underground cavities.
Based on a comprehensive analysis of the on-site geological conditions and previous geological survey data, this study designed five ERT survey lines, oriented from NNE to SSW, with the lines labeled L1, L2, L3, L4, and L5 sequentially from west to east (Figure 1b). The directions of all five lines are consistent with that of the expressway and are parallel to each other, with a spacing of 10 m between each line. The initial design length of each measurement line was 900 m; however, due to site construction conditions and the influence of the road along the Yuanjiang River, there were some deviations from the design length. Specifically, Line 1 has a length of 867 m, Line 2 is 855 m, Line 3 is 867 m, Line 4 is 873 m, and Line 5 is 858 m.
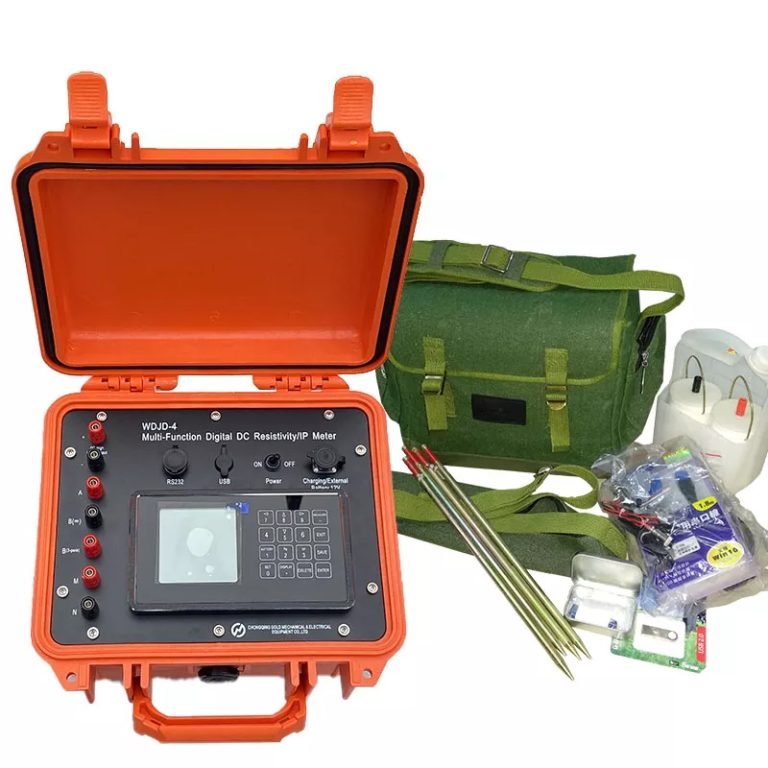
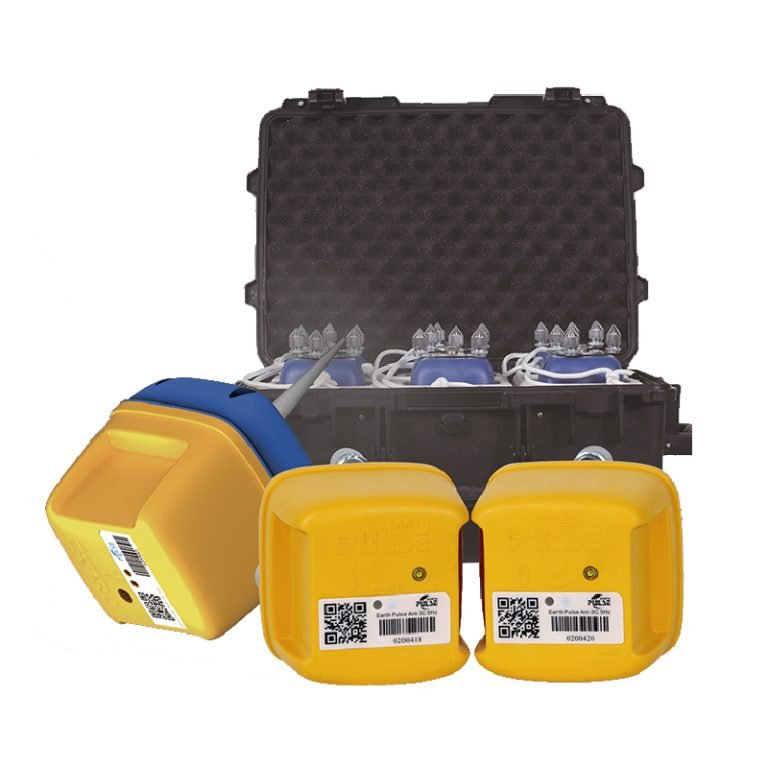
3.2Equipment

The survey utilized the GIM Series Intelligent Resistivity & IP Meter developed by the Geotech, employing the Wenner electrode array for field data acquisition. The electrode spacing was set at 3 m. After collecting the measured data from the five survey lines, the Res2dinv software was used to perform an inversion and interpretation of the data, resulting in five high-resolution two-dimensional cross-sectional profiles.
4. Results
4.1. Measured Results and Geological Interpretation
Figures 4–6 show the inversion results for lines L1, L3 and L5, respectively. Since the inversion results for lines L2 and L4 are similar to those of the other three lines, they are not included in the figures.

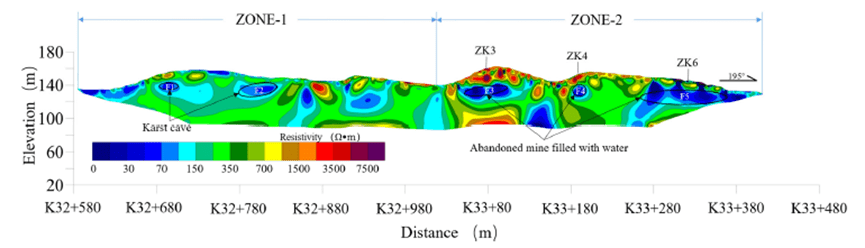

Figure 4 presents the ERT profile for line L1, Due to the electrical contrasts betweendifferent strata, the resistivity profile effectively reflects the presence of undergroundabandoned mining tunnels, In Figure 4, six low-resistivity zones (Vl~V6) are visiblewith the resistivity values all being less than 70 m, Two of these zones are locatedin Zone-l, while the remaining four are located in Zone-2, Since there was continuousrainfall one week prior to the measurements, it is inferred that these six low-resistivityzones are caused by surface water infiltrating into the underground cavities, As shownin Figure l, in the section K32+580~K33+30 along the survey line, the mine is relativelyshallow and primarily mined through open-pit methods, In the range K33+30~K33+440where the mine is deeper, tunnel mining was the main method, Based on the locations anddepths of the low-resistivity zones, it is hypothesized that the two low-resistivity zones inZone-1 correspond to water-filled karst caves while the four low-resistivity zones in Zone-2correspond to water-filled abandoned mining tumnels.Figure 5 presents the ERT profile for line L3, In Figure 5, five low-resistivity zones(F1~F5) are visible, all with resistivity values of less than 70 m, Two of these zones are located in Zone 1 and three are located in Zone2, The two low-resistivity zones inZone-1(V1 and V2) are near K32+690 and K32+810, respectively, at depths of 10~15 msimilar to the corresponding zones in line L1 (Fl and F2), The three low-resistivity zonesinZone-2 (F3, F4, and F5) are also located at the same positions and depths as the fourlow-resistivity zones in line L1 (V3, V4, V5, and V6), Notably, F3 in line L3 appears astwo smaller low-resistivity zones (V3 and V4) in line Ll, indicating that the low-resistivityzones in this area are not fully connected and can be divided into two smaller zones.Figure 6 presents the ERT profile for line L5, In Figure 6, five low-resistivity zones(K1~K5) are visible, all with resistivity values of less than 70 m, Two of these zones arelocated in Zone-l, and three are located in Zone-2. The positions of these five low-resistivityzones are similar to those of the five low-resistivity zones in profile line L3 (Figure 5). FromFigure 6, it can be seen that the low-resistivity zonebetween K33+260 and K33+350 consistsof three small low-resistivitybodies, In contrast, the same location in lines L1 and L3 showsa single continuous large low-resistivity zone which is not fully connected in those lines.
4.2. Borhole Results
To further confirm the location and extent of the underground abandoned miningtunnels or karst caves, this study selected six points for drilling verification after co mpletingthe high-density electrical resistivity field measurements, The drilling locations were basedon the ERT inversion
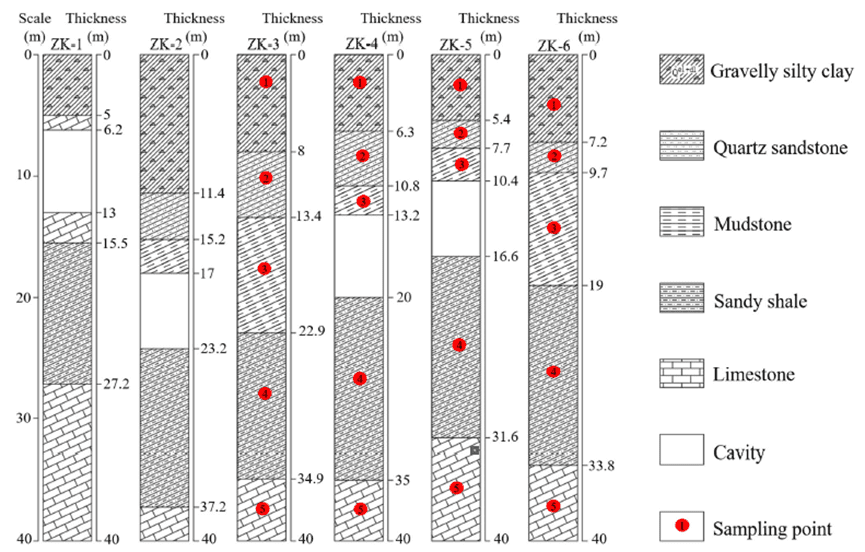
As shown in Figure 7, the cavity at location ZKl is a karst cave, while the cavities atlocations ZK2, ZK4, and ZK5 are abandoned mining tunnels, At the same time, there are no cavities at ZK3 and ZK6, indicating that the large low-resistance zones in the sectionK33+50~K33+110 and K33+50~K33+110 contain more than one aband oned mining tunnel.
5. Discussion
This paper comprehensively analyzes the characteristics of underground cavities inthe study area by integrating ERT inversion results, geological survey data, and boreholedata, The ERT inversion results reveal the presence of six low-resistivity zones in the studyarea, Since the field measurements were conducted during the rainy season and the siteexperienced continuous rainfall in the week prior to the survey, it is inferred that the low.resistivity zones were formed by rainwater infiltrating underground cavities, Thereforethese low-resistivity zones are presu med to indicate the locations of underground cavitiesBased on Figure 3, the two cavities in Zone-l are located within the limestone formationand borehole ZKl data confirm that V1 is a water-filled karst cave, Thus, the two low-resistivity zones near K32+690 and K32+810 are inferred to be water-filled karst caves.The analysis of Figure 3 indicates that the low-resistivity zones in Zone-2 are situ atedwithin the mud stone formation (the stratum containing refractory ore). Among these, thelow-resistivity zone near K33+80 is not fully connected and consists of two smaller lowresistivity zones, whidh ap pear as two independent zones (V1 and V2) in line L1. BoreholeZK2 confirms that this low-resistivity zone is indeed a water-filled mining, tunnel, while theintact core from ZK3 suggests that the F3 low-resistivity zone is not a fully developed goaf.Therefore, it is inferred that the low-resistivity zone near K33+80 comprises two sep aratewater-filled mining tumnels.
By combining Figure 3 and borehole ZK4 data, the low-resistivity zone near K33+190is confirmed to be a water-filled mining tunnel.
The large low-resistivity zone between K33+260 and K33+350 exhibits so me variationsin the inversion results across different survey lines, In line Ll, V6 shows three smallerlow-resistivity zones, with the two closer to the starting point of the line appearing tobe connected, In line L3, F5 also displays three smaller low-resistivity zones, with thetwo closer to the end of the line appearing to be connected, In line L5, K5 presents asthree independent low-resistivity zones, Borehole ZK5 confirms that this zone is indeeda water-filled mining tunnel. Borehole ZK6, located at the junction of the two smallerlow-resistivity zones in F5, indicates that these zones are not fully connected. Therefore, itis inferred that the low-resistivity zone between K33+260 and K33+350 consists of threeindependent water-filled mining tumnels.
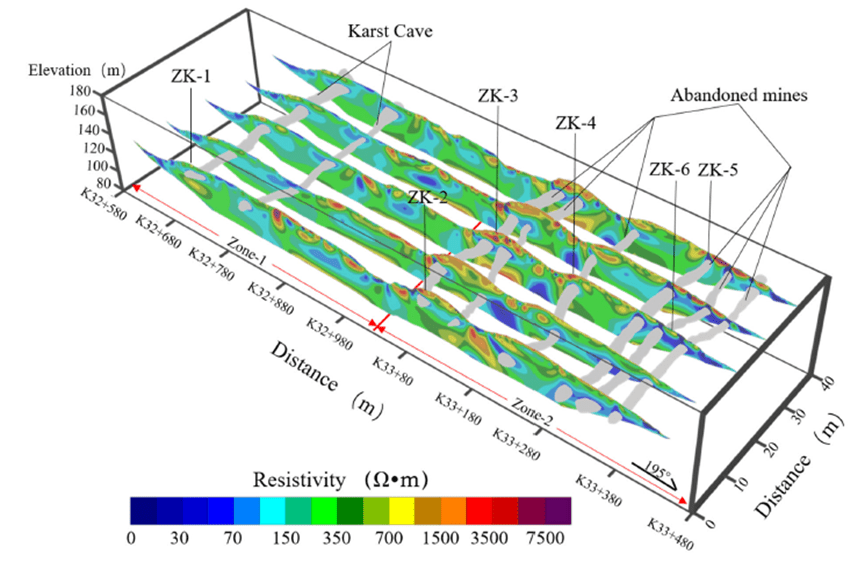
Analysis of the ERT inversion results and borehole data reveals that, when multiplelow-resistivity zones are close to eadh other, they may appear as a single large low-resistivityzone in the inversion results, Tables l and 2 indicate that the mudstone formation containingthe tunnels and the underlying sandy shale formation are relatively fractured. Rainfallinfiltration not only saturates the tunnels but also increases the overall water content of theformation, hen the tunnels are saturated, water within them diffuses into surroundingfractures, causing the surrounding bedrock to also exhibit low resistivity in the inversionresults, In summary, multiple closely spaced low-resistivity zones in the study area mayappear as a single large low-resistivity zone in the inversion results.To better observe the relationship between the underground cavities and the resistivityprofiles, this study arranged the ERT profiles of the five measurement lines according totheir relative positions to construct a threedimensional schematic, Based on the previousinterpretation of the ERT profiles, the karst caves and abandoned mining tunnels were alsodelineated (Figure 8), This figure dearly demonstrates that the five profiles show consistency at the same distances, which further validates that the ERT profiles can accuratelyreflect the subsurface physical property variations, Additionally, based on the interpretation and inferences of each profile, the locations of the karst caves and abandoned miningtunnels were marked, providing, a better representation of the morpholo gical characteristicsof the undergroumd cavities.
6. Conclusions
Geological data from the research area were collected, and ERT was employed togenerate five ERT profiles through data inversion, By integrating drilling results with othergeological information, the status of the abandoned mine’s underground passages wasidentified, The following conclusions were drawn:
- The ERT profiles reveal a total ofeight underground voids along the expressway ro utewith two in Zone-1 being identified as karst caves and six in Zone-2 beingidentifiedas abandoned mining tumnels.
- When two low-resistivity zones are large in volume and closely spaced, they mayappear as a single low-resistivity zone in the inversion results.
- Boreholes not only validate the accuracy of the ERT results but also improve theprecision of the ERT method.
- ERT is effective in reflecting the morphological characteristics of undergroundVoids, providing valuable technical guidance for subsequent project constructionand yoid treatrent.
Further reading | Technical solutions related to this article
In the field of resource exploration and engineering testing, accurate data is the key to success. As an innovator of resource and environmental instruments, Geotech has always taken high-precision electrical exploration technology as its core to provide reliable solutions for global users.
If you want to learn more about how the [Electrical Exploration System (ERT)] can help mineral exploration and geological research, please click on the electrical instrument product page to explore details, or visit Geotech’s official website to view the full range of exploration equipment (covering more than ten categories of products such as magnetometers, seismic nodes, and geological radars). Our technical team is on call at any time to customize scientific solutions for your project – making unknown strata a controllable data map.
FAQ
What is the main difference between a single tap and a double tap?
What is the principle of high-density electrical prospecting?
What are the advantages of high-density electrical method?
In what fields is the high-density electrical method generally used?
What are the application characteristics of high-density electrical method?