Welcome to Geotech!
Comprehensive geophysical exploration methods Solution in underground obstacle detection
Description
1 Introduction
1.1 Project Overview
A pharmaceutical factory was founded in 1952 and is engaged in the production and research and development of raw materials and preparations . It moved to the current pharmaceutical factory address in 1986 , with a total area of approximately 78,553 square meters .
This project is mainly to conduct a detailed investigation of the soil pollution status of the plot. The surveyed plot was originally distributed with production areas, office areas, sewage treatment areas, etc., and there may be obstacles such as buried sewage treatment tanks and pipelines, and the situation is unclear. Before the investigation and construction, it is necessary to conduct a detailed investigation of the distribution of underground obstacles to avoid touching or damaging underground pipelines during the later investigation process, causing sudden accidents, causing personal injury or affecting the normal operation of society. In order to ensure the safety of on-site sampling, the investigation implementation unit is required to use geophysical detection technology to detect underground pipelines at locations such as the intended drilling points on the basis of further collecting pipeline distribution information. Therefore, before conducting drilling operations, it is related to construction safety and the smooth implementation of the project to find out the location, direction and buried depth of underground pipelines.
1.2 Work objectives and tasks
Under the commission , Geotech ‘s partners undertook the underground obstacle exploration of the land parcel (hereinafter referred to as the “survey area”) . In order to clarify the distribution of obstacles in the survey area, it is planned to use geophysical exploration technology to detect the areas where pipelines, landfills and structures are distributed in the survey area . Therefore, the purpose of the geophysical exploration here is:
- Detect and investigate the distribution and direction of pipelines in the area.
- Detect and investigate the distribution of landfill pools and structures in the survey area.
Considering the purpose of this survey and the site conditions, the geophysical detection technologies to be used this time are planned to be the high-density resistivity method and the detection radar method.
The high-density electrical method is particularly sensitive to the resistivity characteristics of surrounding rocks and structures . When there are structures distributed underground , the layered features in the resistivity image are destroyed, and strip-shaped or elliptical color blocks appear , which can well distinguish the distribution of surrounding rocks and structures.
Ground penetrating radar uses high-frequency broadband electromagnetic waves to receive reflected waves from underground interfaces, and interprets and infers the underground medium structure based on the travel time, amplitude and waveform data of the reflected waves. As long as there is a sufficient electrical difference between the underground pipeline or structure target and the surrounding medium, it can be discovered by ground penetrating radar , and the pipeline detection capability of ground penetrating radar makes up for the detection defects of pipeline detectors, especially for the detection of non-metallic pipelines. Therefore, ground penetrating radar has become an essential equipment for urban underground pipeline detection .
At the same time, according to the engineering survey report of the survey area and the on-site survey, the groundwater in the survey area is shallow, and the surface is overgrown with weeds, which is basically wet fill. The detection depth of ground penetrating radar in this site is limited. Therefore, the ground penetrating radar method is only used to detect the distribution of pipelines in the plot. The high-density resistivity method is used to detect the possible distribution of buried sewage treatment tanks and other underground structures.
1.3 Scope of investigation
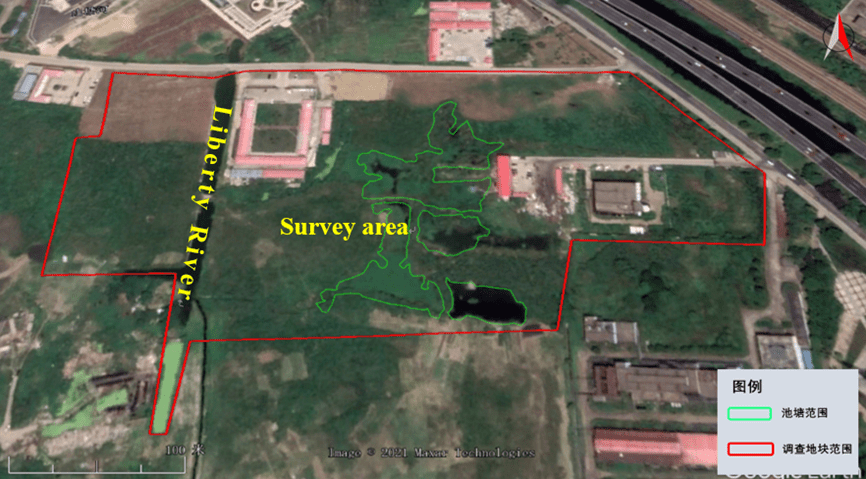
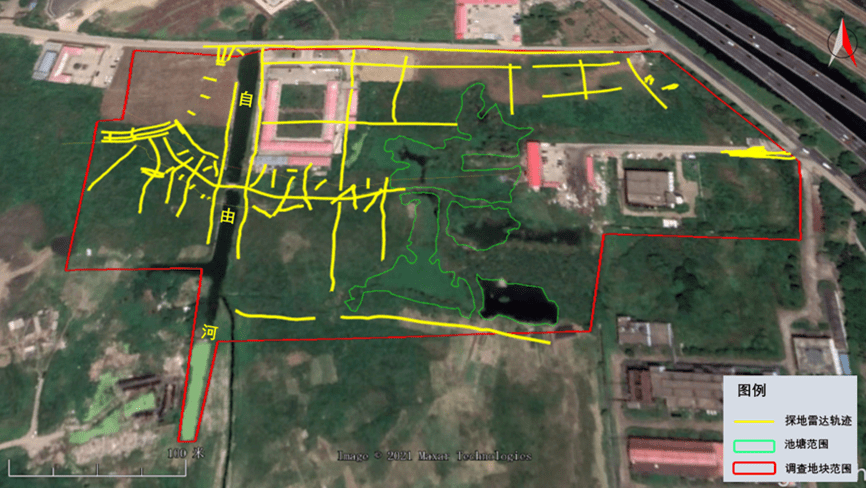
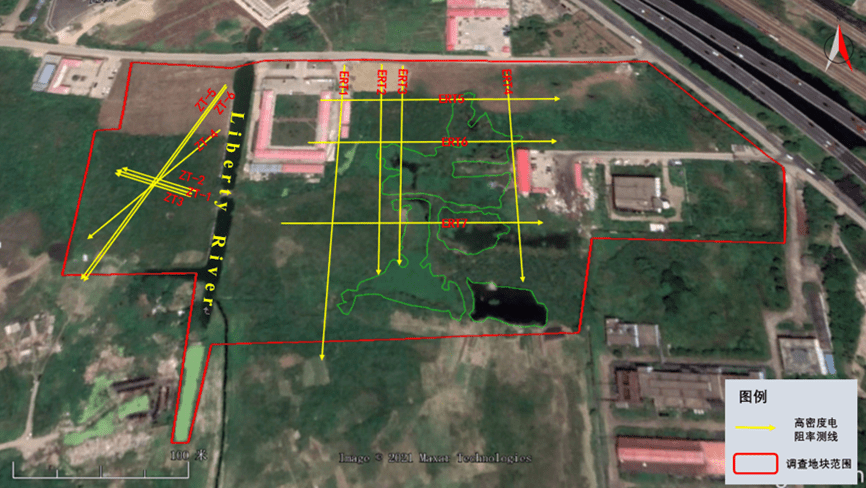
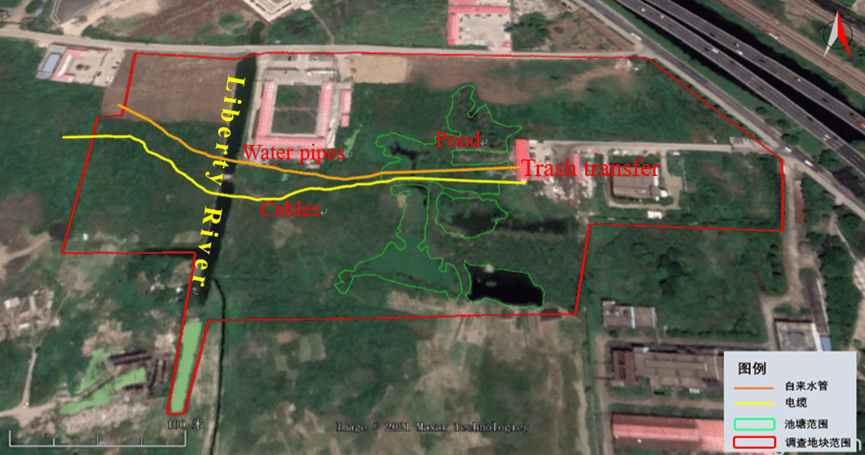
The survey area of this plot is the original site of a pharmaceutical factory . The plot is roughly as follows: east to West Ring Expressway (Huquan Road), west to Ziyou Village (now demolished), south to Lushan Road, and north to Ziyou Road. The plot is divided into two areas, the East District and the West District, with the Ziyou River as the boundary, with a total area of approximately 78,553 square meters . The plot range is shown in Figure 1-1.
1.4 Working basis
(1) Standards for Geophysical Exploration in Urban Engineering (CJJ7-2017);
(2) Technical Specification for Resistivity Profile Method (DZ/T0073-2016);
(3) Technical Specifications for Resistivity Sounding Method (DZ/T0072-93);
(4) Safety Code for Geotechnical Engineering Investigation (GB/T50585-2019);
(5) Technical Specifications for Detection of Urban Underground Pipelines (CJJ 61-2017;
(6) Technical Code for Engineering Surveying (DB11/T 339-2016) .
2 Geophysical exploration
2.1 Basic description of detection
Invisible materials based on natural or artificial geophysical fields , and infer changes in the physical properties of underground media based on abnormal changes.
This survey is planned to use high-density electrical method and ground penetrating radar method. High-density electrical method is particularly sensitive to strata and surrounding rocks. The apparent resistivity of surrounding rocks is significantly reduced when they are broken and contain water. The apparent resistivity of intact and hard rock and soil is significantly higher than that of surrounding rocks in fault zones or broken zones and water-rich zones. When there are structures, the layered features in the distribution image are destroyed, and strip-shaped or elliptical low-resistance color blocks appear. For unsaturated Quaternary soil layers : the higher the water content and density, the smaller the particle size , the lower the resistivity value ; when the water content and particle size remain unchanged, the resistivity value basically reflects the change in soil density. When cracks develop in homogeneous unsaturated soil layers , the cracks are filled with air and the soil density around the cracks is inevitably relatively reduced. At this time, the cracks are reflected as high-resistance abnormal zones on the resistivity profile . The ground penetrating radar method takes the difference in dielectric properties of the medium in the detection object as the physical premise, and solves the engineering geological problems of underground disease bodies by observing and studying the laws of reflected electromagnetic wave signals. The media involved in this detection are mainly air, water, soil, and underground pipelines made of concrete, metal or PVC. Generally speaking, for uniform and dense soil, the main characteristics of electromagnetic wave reflection signals are that the overall energy of the reflection signal is uniform, the frequency is moderate, and the phase is continuous. However, due to the influence of composition, density and water content, there will be weak signal reflection inside the soil, which is characterized by some medium-frequency reflection signals, with small frequency changes in the entire range, continuous and uniformly parallel phase axes, and weak signal amplitude; when there are structures or pipelines between soils, the reflection signal characteristics are mainly regional strong reflections, in the form of inverted hyperbolas, with the development of diffraction waves and multiple waves, and higher frequencies. According to the preliminary exploration and investigation of the site, the survey area may be distributed with obstacles such as buried sewage treatment tanks and pipelines. The surface buildings in the survey area have been basically demolished and are basically fill layers . It can be seen that there are obvious differences in the resistivity characteristics, electromagnetic wave velocity and wave field characteristics of the main underground structures and pipelines within the survey area. This provides a good geophysical prerequisite for the use of geological radar methods based on electromagnetic wave velocity and electrical characteristics and high-density resistivity methods to detect underground obstacles .
2.2 Detection method principle
2.2.1 Principle of high – density resistivity method
Electric Resistivity Method is based on the difference in dielectric resistivity . It observes the power supply current intensity and the potential difference between the measuring electrodes, and then calculates and studies the apparent resistivity to infer the distribution of potentially contaminated soil underground. The measured result is the earth resistivity profile. Factors that affect the resistivity of the formation include the constituent minerals, particle size, configuration, and the water content of the formation and the substances contained in the water. When there is a clear resistivity contrast in the formation, the DC resistance method is applicable.
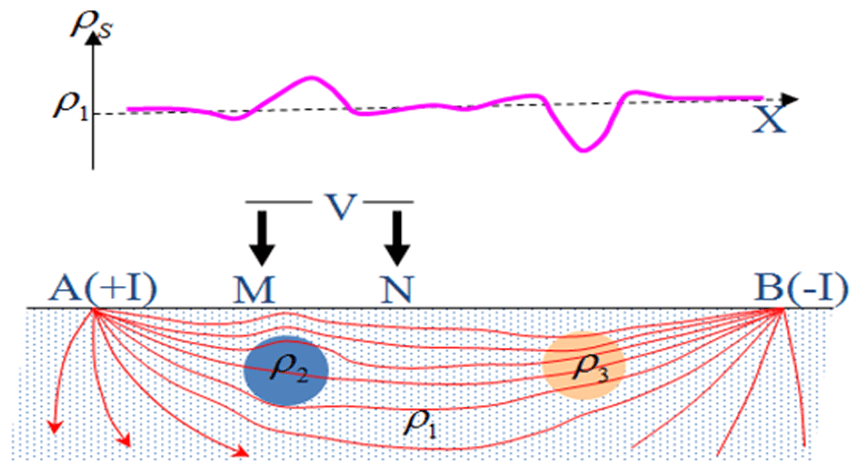
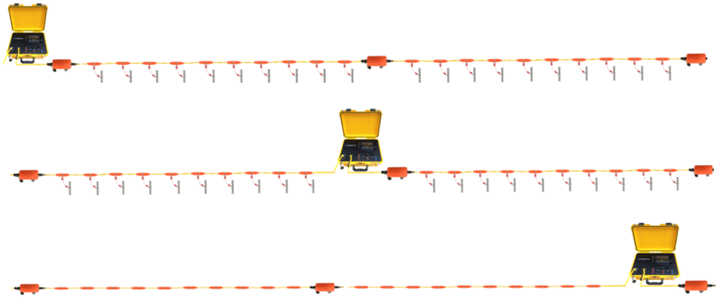
High-density electrical method is the most widely used electrical survey developed from resistivity method. Its basic theory is exactly the same as traditional resistivity method . The difference is that high-density electrical method sets higher density of measuring points in observation . When measuring on site , all electrodes need to be arranged at measuring points with certain intervals, and the host automatically controls the changes of power supply electrodes and receiving electrodes . High-density electrical measurement system adopts advanced automatic control theory and large-scale integrated circuits , uses a large number of electrodes , and the electrodes can be freely combined, so that more geoelectric information can be extracted , so that electrical exploration can use multiple coverage measurement methods like seismic exploration .
The high-density electrical method has the following advantages:
① The electrode layout is completed in one go , reducing the interference caused by the electrode setting and the resulting measurement errors ;
② It can effectively carry out scanning measurements of various electrode arrangements, thereby obtaining richer geological information about the structural characteristics of the geoelectric section ;
③ Field data collection is automated or semi-automated , which not only speeds up the collection but also avoids errors caused by manual operation ;
④ It can realize on-site real-time processing and offline processing of data, greatly improving the intelligence level of the electrical method .
2.2.2 Principle of Ground Penetrating Radar
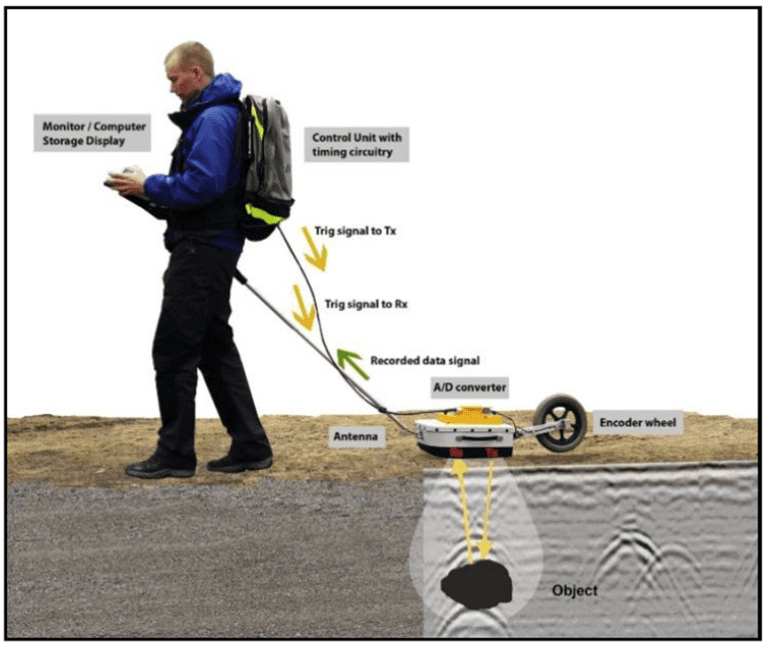
Ground penetrating radar uses high-frequency electromagnetic waves (main frequency is tens of megahertz to hundreds of megahertz or even gigahertz ) in the form of broadband short pulses, which are sent from the ground through the transmitting antenna T into the ground, and then reflected by the underground strata or target body and returned to the ground, where they are received by the ground receiving antenna R. Because underground media often have different physical properties, such as the dielectric , electrical conductivity and magnetic permeability of the medium, they have different wave impedances for electromagnetic waves. When the electromagnetic waves entering the ground pass through various underground strata or other target bodies, due to the different wave impedances on both sides of the interface, the electromagnetic waves will be reflected and refracted on the interface of the medium. The propagation path, electromagnetic wave field intensity and waveform of the electromagnetic wave pulse reflected back to the ground will change with the electrical properties and geometric form of the medium through which it passes . The received radar wave waveform, intensity, phase and geometric form are analyzed to achieve the detection of the target body.
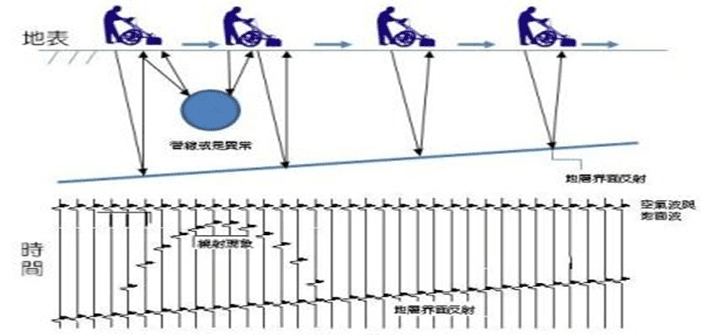
The most common tubular targets in the practical application of geological radar are steel bars , pipelines and some karst. When the geological radar detects perpendicularly to the tubular target, the morphological characteristics of its image are shown as a parabola. The vertex of the parabola truly reflects the position of the tubular target in space; the “wings” on both sides of the parabola except the vertex are the diffraction phenomenon of the wave, which does not really exist, but is an important indicator of the tubular target.
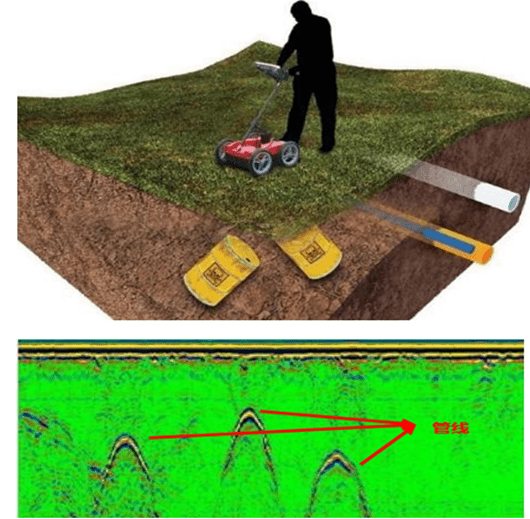
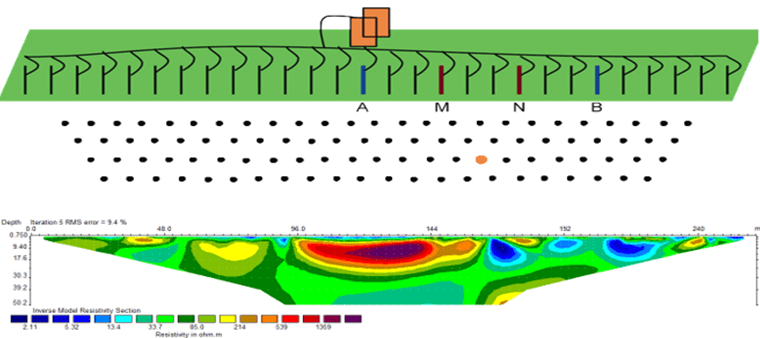
Figure 2-4 is a schematic diagram of the waveform record of the corresponding target. The figure shows the waveform record in comparison with a simple geological model. On the waveform record diagram, each measuring point records the waveform in the vertical direction of the measuring line to form a radar profile. Similar to the reflection seismic profile, the radar profile also has the problem of offset of the reflected wave and the homing of the diffraction wave, so the radar image also needs to be offset.
2.3 Instruments and equipment
Investigation equipment is the basis for completing the investigation work. Our company is equipped with complete instruments and equipment according to the implementation requirements of the investigation work to ensure that the needs of the investigation work are met. At the same time, before construction, the required testing instruments and equipment are comprehensively and carefully inspected and tested to ensure that the on-site testing work can be carried out smoothly.
The main testing equipment and instruments invested in this project are shown in the following table:
| Serial number | Device Name | Specifications | quantity |
| 1 | GIM Series High Density Resistivity Tester | GIM-10 | 1 set |
| 2 | IDS Hand-Push 3D Ground Penetrating Radar | GEM-2 | 1 set |
| 3 | SPP-400 Power Supply | GD Series | 2 units |
| 4 | GPS-RTK | Chihiro | 1 unit |
| 5 | tape | / | n sets |
Main equipment introduction :
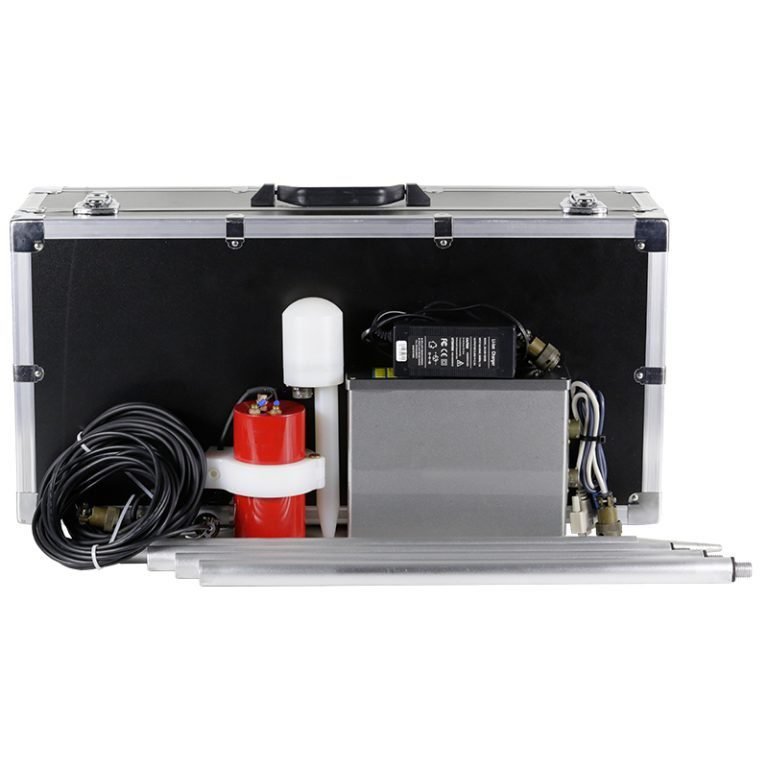
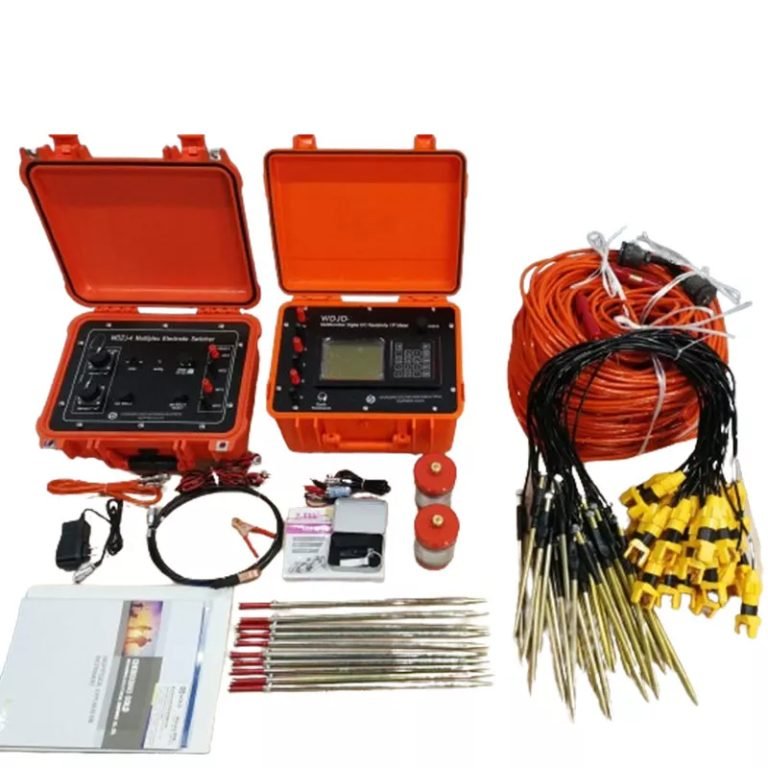
( 1 ) GIM10 high density resistance meter

GIM10 high-density resistivity meter is a world-leading multifunctional distributed high-density resistivity meter developed by Geotech ‘s latest digital and analog circuit technology. It can be used for self-resistivity, apparent resistivity and induced polarization testing, and can use two-dimensional and three-dimensional devices for cross-section testing. The product is easy to operate, high in accuracy, and has strong visualization, meeting the measurement needs of various application scenarios such as ground and water.
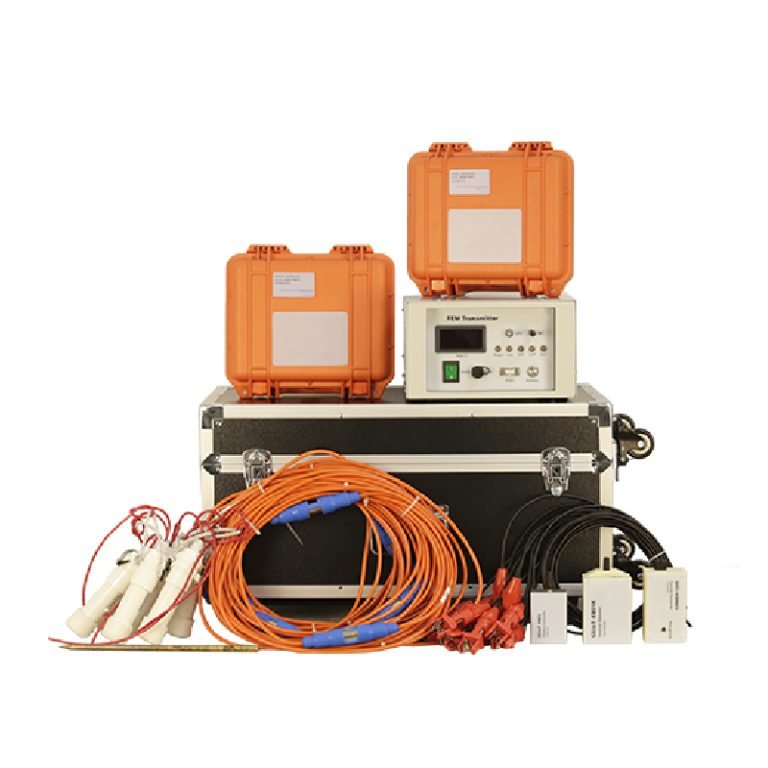
( 2 ) GER Series 3D Ground Penetrating Radar
This geological radar uses Geotech ‘s GER Series 3D geological radar is a new technology developed abroad in recent years. It consists of a front-end data acquisition system and a central data processing and interpretation system. The front-end data acquisition system includes radar array antenna (integrated host), GNSS precise positioning equipment, control host, engineering tractor, etc., which synchronously collects 3D radar images, image coordinate positions, surface features, markers and other data information. The central data processing and interpretation system consists of a data processing server and data processing software. It “slices” the radar images collected by the front end in different directions to judge and analyze the location and shape of underground pipelines, and then track the direction of pipelines and other information.

3. On-site work and testing
As mentioned above, the ground penetrating radar method was used to detect the pipeline distribution in the needle plot; the high-density resistivity method was used to detect the possible distribution of buried sewage treatment tanks and other underground structures .
3.1 Pipeline detection
According to the results of the first phase of personnel interviews, during the production and operation of the Fourth Pharmaceutical Factory, the sewage pipelines and power pipelines in the factory were laid overhead and were not buried underground. At the same time, combined with on-site surveys and pipeline detectors and radar detection screening, except for a buried cable and water pipe mark, there were no new pipelines or pre-buried pipelines for municipal, gas, telecommunications and other departments on the site.
Therefore, the focus of this ground-penetrating radar work is to detect the distribution and direction of the water pipes and cables, to mark and confirm the water pipes and cables on site, and to measure the coordinate location information.
3.1.1 GPR survey line layout method
The location and direction of water pipes and cables are mainly detected by vertical or oblique cutting of the cable direction, with point-by-point tracking and full coverage.
According to the on-site survey and some pipeline markings, the cables and water pipes may pass through the east and west sides of the plot, and cross the Ziyou River, and the pipelines can be seen on both sides of the river. Therefore, we first start to track and detect the cable direction and location information from the water pipes and cables visible on both sides of the river. During work, data acquisition uses differential GPS+Doppler radar ranging for positioning, and the antenna movement rate is no more than 15km/h. The location and related information of the signal anomaly should be recorded in time, and the cause of the anomaly should be analyzed. After the data acquisition is completed, the professional three-dimensional data processing software IQMAP is used for processing. The software displays the data in three dimensions and can directly determine the cable direction and buried depth. The specific detection method is as follows:
3.2 Detection of pool and structures
This time, the high-density resistivity method was used to detect possible buried sewage treatment tanks and other underground structures .
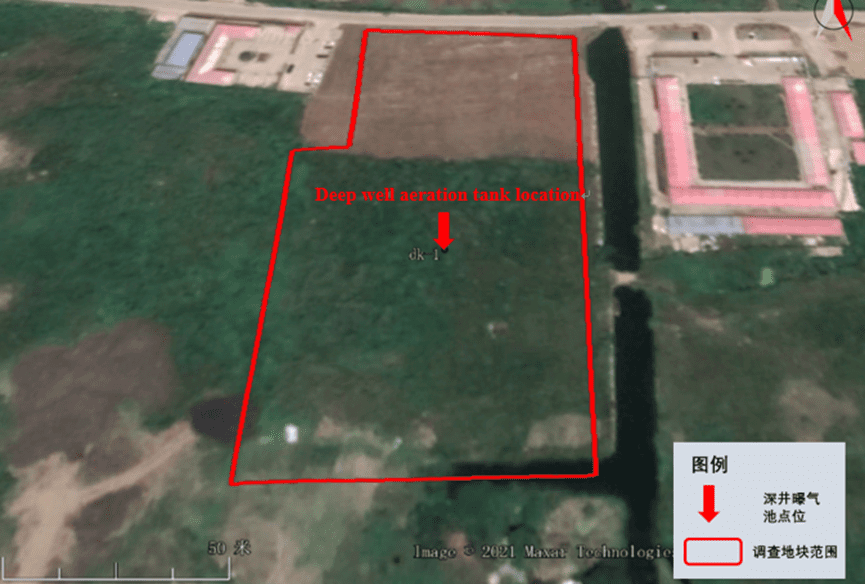
During the on-site survey , no exposed underground storage tanks or underground facilities were found on the east and west sides of the plot. At the same time, combined with the data and interviews, a deep well aeration tank was set up on the west side of the plot (sewage treatment facility) , which was about 85m deep, with a concentric structure, a diameter of 1.8m, a well volume of 208m3 , and a perforated tube aerator set 40m below the water surface. The aeration device was welded into a cylindrical shape with steel plates and placed in the deep well using a crane . After the factory area was dismantled, the wellhead of the deep well aeration tank was covered with fill, resulting in the loss of the specific location information of the well. After the excavator was used on site to strip the topsoil, the wellhead was not found. Therefore, this time the west side of the plot was mainly used to determine the location information of the wellhead of the deep well aeration tank to provide information for later drilling and sampling .
3.2.1 ERT survey line layout
In order to more comprehensively detect the pool body of the plot and determine the location information of the aeration pool wellhead on the west side, 7 ERT survey lines (ERT1 – ERT7 ) were laid out in the key areas on the east side of the plot . The location detection of the aeration pool on the west side was carried out in the key areas determined after reviewing the original data and interviewing personnel ( ZT-1 – ZT-7 ), a total of 13 ERT lines . At the same time, the survey lines ZT -1, ZT-2, and ZT-3 are 3 parallel survey lines with a line spacing of 1 meter. ZT-5 and ZT-6 are 2 parallel survey lines with a line spacing of about 1 meter . ZT-4 is horizontally located at 58 meters and is adjacent to ZT-6 . The horizontal position intersects at 94 meters . In the east area of the plot, E RT1-ERT4 are parallel survey lines, and E RT5-ERT7 are also parallel survey lines, as shown in Figure 3-2 .
The Wenner – Schlumberger Array was used for detection at the site . This mixed array combines the detection characteristics of two different arrays. The Wenner array has better resolution for horizontal layered structures, and the Schlumberger array is relatively sensitive for vertical structure detection. The mixed array has achieved a more comprehensive detection array for horizontal and vertical distribution structures, which is particularly suitable for sites with unclear underground conditions or more complex sites; therefore, it can effectively resolve the area. Taking into account the need for more accurate estimates in the survey area, this ERT survey adopted a 2m electrode spacing for the eastern area of the plot, and a 1m and 2m electrode spacing for aeration tank well location detection. The corresponding detection resolution is about 0.5m or more, as shown in Figure 3-2 ( yellow solid line) , and the arrow indicates the survey line from the starting point to the end point .
3.3 Completion of work
The field data collection work of geophysical method survey started on the morning of December 12, 2021 and ended on the afternoon of December 28, 2021. The completion status is as follows: the ground penetrating radar data collection in the detectable area was completed and the cable direction was fully covered; 13 high-density electrical survey lines were completed, totaling 1,136 lines , with a total survey line length of 1,950 meters. Among them, ERT work adopts RTK positioning and the principle of tape measure distance determination, and ground penetrating radar collection adopts differential GPS + Doppler radar ranging for positioning. The basic data of the detection technology are shown in Table 3-1, and the coordinates of the ERT survey line are shown in Table 3-2. The focus of the work is to detect obstacles. Through the technical means of high-density electrical method and ground penetrating radar method, the expected effect can be achieved and the design requirements can be met, which provides the necessary basis for determining the later work plan.
| Testing method | Strip /Area | Target Depth | Electrode arrangement | Measuring point spacing | Remark |
| 3D Ground Penetrating Radar | Full coverage | Within 2 meters | / | 0.1~0.3m | Detection of pipeline distribution in plots |
| High-density electrochemical method | 13 survey lines | Within 30 meters | Quadrupole method | 1 – 2 m | Detection of obstacles below the belt |
| Detection method | illustrate | Line number | Electrode spacing ( m ) | Number of channels | Length ( m ) | Measuring device |
| High-density resistivity method | East District Land Detection | ERT1 | 2 | 120 | 238 | Wenner -Schlumberger Array |
| ERT2 | 2 | 90 | 178 | Wenner -Schlumberger Array | ||
| ERT3 | 2 | 86 | 170 | Wenner -Schlumberger Array | ||
| ERT4 | 2 | 90 | 178 | Wenner -Schlumberger Array | ||
| ERT5 | 2 | 90 | 178 | Wenner -Schlumberger Array | ||
| ERT6 | 2 | 90 | 178 | Wenner -Schlumberger Array | ||
| ERT7 | 2 | 90 | 178 | Wenner -Schlumberger Array | ||
| The most popular sports car in the world | ZT-1 | 1 | 60 | 59 | Wenner-Schlumberger Array | |
| ZT-2 | 1 | 60 | 59 | Wenner-Schlumberger Array | ||
| ZT-3 | 1 | 60 | 59 | Wenner-Schlumberger Array | ||
| ZT-4 | 1 | 120 | 119 | Wenner-Schlumberger Array | ||
| ZT-5 | 2 | 90 | 178 | Wenner-Schlumberger Array | ||
| ZT-6 | 2 | 90 | 178 | Wenner-Schlumberger Array |
| serial number | Start and end coordinates | Latitude (°) | Longitude (°) | North coordinate | Dong coordinates | Elevation |
| ERT 1 | Starting coordinates | 31.33751628 | 120.55420075 | 3468528.215 | 552741.578 | 10.511 |
| End coordinates | 31.33536758 | 120.55418714 | 3468289.966 | 552741.481 | 11.745 | |
| ERT 2 | Starting coordinates | 31.33751849 | 120.55449416 | 3468528.601 | 552769.500 | 10.450 |
| End coordinates | 31.33591627 | 120.55452610 | 3468350.965 | 552773.434 | 10.144 | |
| ERT 3 | Starting coordinates | 31.33751197 | 120.55466833 | 3468527.961 | 552786.079 | 10.514 |
| End coordinates | 31.33598485 | 120.55467079 | 3468358.639 | 552787.165 | 10.047 | |
| ERT 4 | Starting coordinates | 31.33746041 | 120.55549605 | 3468522.641 | 552864.880 | 10.393 |
| End coordinates | 31.33585955 | 120.55552073 | 3468345.153 | 552868.124 | 9.895 | |
| ERT 5 | Starting coordinates | 31.33720849 | 120.55403388 | 3468494.008 | 552725.869 | 9.947 |
| End coordinates | 31.33721362 | 120.55589925 | 3468495.471 | 552903.390 | 10.395 | |
| ERT 6 | Starting coordinates | 31.33686618 | 120.55396953 | 3468456.023 | 552719.935 | 10.233 |
| End coordinates | 31.33686771 | 120.55583459 | 3468457.086 | 552897.430 | 9.973 | |
| ERT7 | Starting coordinates | 31.33626205 | 120.55381993 | 3468388.967 | 552706.035 | 10.282 |
| End coordinates | 31.33625682 | 120.55568742 | 3468389.281 | 552883.766 | 10.243 | |
| Z T-1 | Starting coordinates | 31.33663204 | 120.55258308 | 3468429.399 | 552588.118 | 10.048 |
| End coordinates | 31.33647277 | 120.55315163 | 3468412.011 | 552642.316 | 10.050 | |
| Z T-2 | Starting coordinates | 31.33664800 | 120.55257798 | 3468431.166 | 552587.624 | 10.319 |
| End coordinates | 31.33648741 | 120.55315310 | 3468413.635 | 552642.447 | 10.235 | |
| Z T-3 | Starting coordinates | 31.33662706 | 120.55257224 | 3468428.842 | 552587.090 | 10.072 |
| End coordinates | 31.33646909 | 120.55316150 | 3468411.607 | 552643.257 | 10.070 | |
| Z T-4 | Starting coordinates | 31.33697555 | 120.55328320 | 3468467.822 | 552654.557 | 10.234 |
| End coordinates | 31.33615986 | 120.55249719 | 3468377.004 | 552580.207 | 11.974 | |
| Z T-5 | Starting coordinates | 31.33733689 | 120.55327879 | 3468507.883 | 552653.936 | 10.479 |
| End coordinates | 31.33587939 | 120.55251567 | 3468345.915 | 552582.121 | 13.023 | |
| Z T-6 | Starting coordinates | 31.33733485 | 120.55328679 | 3468507.661 | 552654.698 | 10.141 |
| End coordinates | 31.33587580 | 120.55253016 | 3468345.523 | 552583.502 | 12.832 |
4 Results and interpretation
4.1 3D GPR results and interpretation
The method of pipeline detection in this plot is to first use radar to conduct an initial screening of the entire plot, and at the same time determine the type of pipelines in the plot based on known information and on-site identification, and then track the pipelines point by point and detect them in a full coverage manner to determine the direction of the cables and the depth of burial.
After screening, it was found that except for a buried cable and water pipe, there were no new pipelines or pre-buried pipelines for municipal, gas, telecommunications and other departments. Therefore, the focus of the ground penetrating radar is to find the direction, burial depth and location of the cable and water pipe.
Hand-pushed three-dimensional ground penetrating radar was used for on-site operations. Differential GPS + Doppler radar ranging was used for positioning during data collection , and IQ map processing software was used for processing. This software can “slice” the radar image in different directions to determine and analyze the location of underground pipelines and present the data results in three dimensions to determine the direction and burial depth of water pipes and cables. The specific results are shown in Figures 3-1 to 3-4 below .
(1) Cable detection

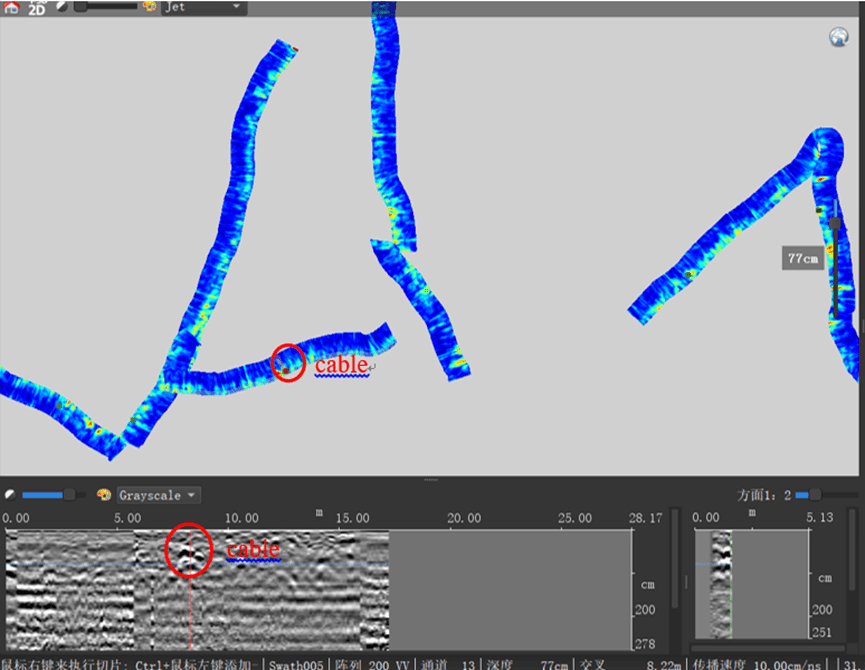
Figure 4-1 above , the map is divided into two parts, the upper part of the color page plane map is a three-dimensional slice result map, and the “red-green-blue” color represents the amplitude. This interface can present radar plane results at different depths. The lower part of the grayscale profile map is the two-dimensional result map of the corresponding channel. From the radar results map, at the horizontal position of 17.5 meters , a bright spot with strong amplitude can be seen in the plane map, and its corresponding two-dimensional grayscale map shows obvious hyperbolic diffraction, which is an important indicator feature of the tubular target. Combined with the on-site situation, it can be known that the anomaly is a cable with a buried depth of about 25 cm .

From the radar results atlas 4-2 , we can see that a bright spot with strong amplitude can be seen in the plane map, and the horizontal position of the corresponding two-dimensional map is at 22.5 meters. Obvious hyperbolic diffraction can be seen, which is an important indicator feature of the tubular target. Combined with the on-site situation, we can know that the anomaly is a cable with a buried depth of about 25 cm .
From the radar result map 4-3 , we can see that the horizontal position of the two-dimensional grayscale image is at 8 meters, and obvious hyperbolic diffraction can be seen. The corresponding plane map shows a strong amplitude bright spot, which is an important indicator feature of the tubular target. Combined with the on-site situation, we can know that the anomaly is a cable with a buried depth of about 26 cm .

Similarly, the cable is gradually explored and clarified in the same way, and all data are displayed in a three-dimensional plane to analyze the direction of the cable, as shown in Figure 4-4 (yellow line) above. The corresponding strong amplitude bright spots are connected in series with yellow lines to detect the direction of the cable, and the coordinate information of the cable is derived according to the corresponding points, as shown in Table 4-1 below . At the same time, according to the results, the buried depth of the cable is about 25 cm .
( 2 ) Water pipe detection
The detection and tracking method of water pipes is the same as that of cable detection. Both start from the visible water pipes on both sides of the river, gradually cover and detect, and analyze their direction and buried depth. See the following results figure for details.
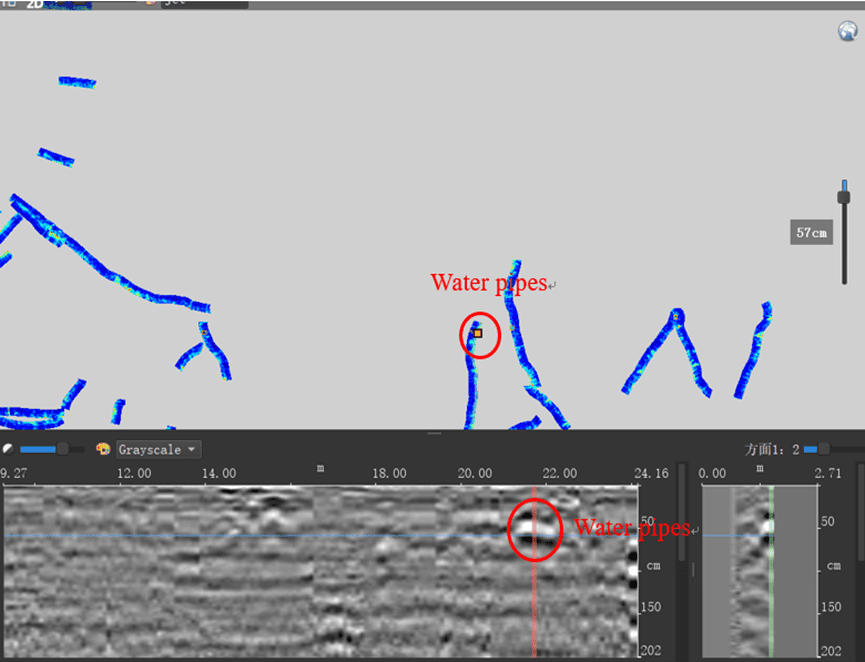
From the radar results atlas 4-5 , we can see that at the horizontal position of 21.5 meters in the grayscale image, obvious hyperbolic diffraction waves can be seen, and strong amplitude bright spots can be seen in the plane map, which is an important indicator feature of the tubular target. Combined with the on-site situation, we can know that the anomaly is a water pipe with a buried depth of about 21 cm .
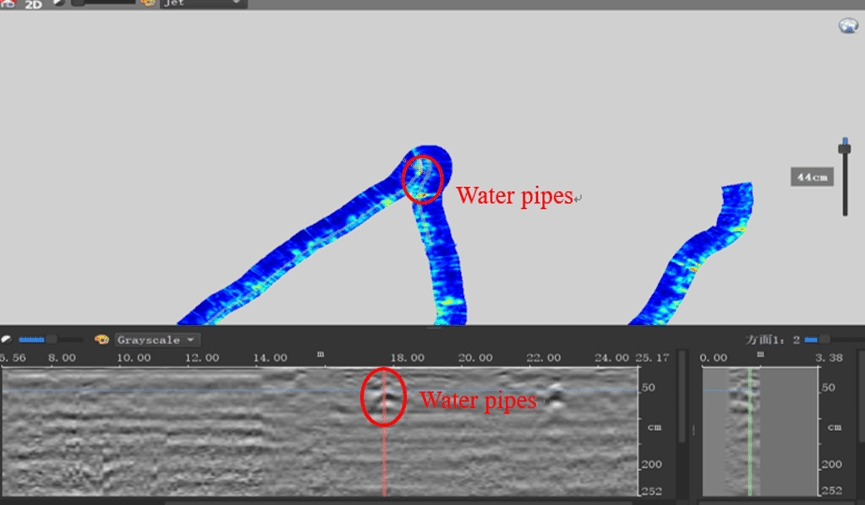
From radar results atlas 4-6 , we can see that a bright spot with strong amplitude can be seen in the plane map, and its corresponding grayscale image is located at a horizontal position of 17.5 meters. Obvious hyperbolic diffraction can be seen, which is an important indicator feature of the tubular target. Combined with the on-site situation, it can be seen that the anomaly is a water pipe with a buried depth of about 20 cm .
Similarly, the tap water is gradually explored in the same way, and all data are displayed in a three-dimensional plane to analyze its direction, as shown in Figures 4-7 (orange line) above. The corresponding strong amplitude bright spots are connected in series with orange lines to detect the direction of the tap water pipe, and the coordinate information is derived according to the corresponding points. At the same time , according to the results, the buried depth of the tap water pipe is about 20 cm .
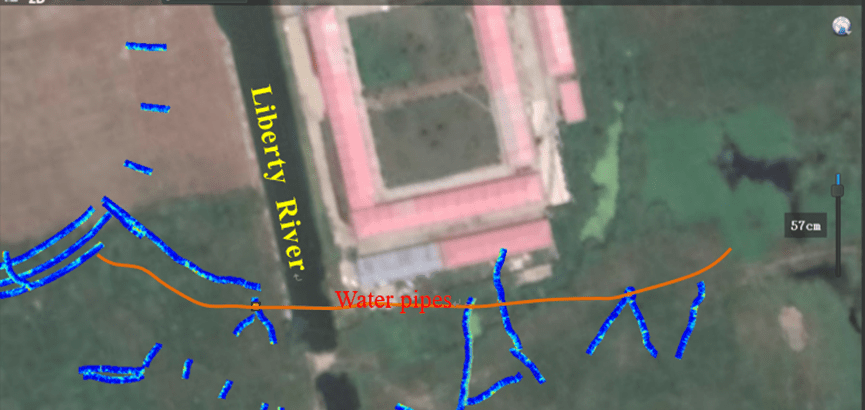
Import the data coordinate information into the base map, draw the direction of the cable and tap water, and combine with the on-site review to know that the cable and tap water pipes are from the west side of the plot to the east side, then enter the pond and pass through the pond to the garbage transfer station. As shown in Figures 4 – 8 .
| Point | latitude | longitude | North coordinate | East coordinate | Elevation |
| dlg-1 | 31.33646137 | 120.55460990 | 3468411.445 | 552781.105 | 9.946 |
| dlg-2 | 31.33645718 | 120.55460444 | 3468410.978 | 552780.587 | 10.014 |
| dlg-3 | 31.33645081 | 120.55454493 | 3468410.243 | 552774.928 | 10.144 |
| dlg-4 | 31.33642959 | 120.55444158 | 3468407.841 | 552765.103 | 10.553 |
| dlg-5 | 31.33641534 | 120.55431527 | 3468406.200 | 552753.090 | 10.616 |
| dlg-6 | 31.33640034 | 120.55403614 | 3468404.404 | 552726.534 | 10.466 |
| dlg-7 | 31.33639054 | 120.55399758 | 3468403.298 | 552722.870 | 10.485 |
| dlg-8 | 31.33631424 | 120.55371551 | 3468394.704 | 552696.068 | 10,184 |
| dlg-9 | 31.33632724 | 120.55357245 | 3468396.077 | 552682.446 | 10,078 |
| dlg-10 | 31.33633147 | 120.55353418 | 3468396.528 | 552678.801 | 9,986 |
| dlg-11 | 31.33633501 | 120.55345116 | 3468396.880 | 552670.898 | 10,053 |
| dlg-12 | 31.33637353 | 120.55327201 | 3468401.065 | 552653.827 | 10.285 |
| dlg-13 | 31.33651006 | 120.55306905 | 3468416.106 | 552634.436 | 10.262 |
| dlg-14 | 31.33664102 | 120.55286034 | 3468430.527 | 552614.500 | 10.321 |
| dlg-15 | 31.33665042 | 120.55283514 | 3468431.557 | 552612.096 | 10.214 |
| dlg-16 | 31.33668679 | 120.55278054 | 3468435.564 | 552606.880 | 10.681 |
| dlg-17 | 31.33675272 | 120.55271981 | 3468442.845 | 552601.064 | 10.436 |
| dlg-18 | 31.33676516 | 120.55267709 | 3468444.204 | 552596.991 | 10.337 |
| dlg-19 | 31.33677824 | 120.55265621 | 3468445.644 | 552594.997 | 10.270 |
| dlg-20 | 31.33679651 | 120.55252288 | 3468447.606 | 552582.298 | 11.133 |
| dlg-21 | 31.33678612 | 120.55212183 | 3468446.263 | 552544.136 | 10.555 |
4.2 High-density electrical method results and interpretation
This time, the high-density resistivity method is used to detect the possible underground sewage treatment tanks and other underground obstacles. At the same time, as shown in Section 3.2 , the east side of the plot (east side of the Freedom River) is mainly used to detect underground storage tanks or underground pool facilities ; the west side of the plot (west side of the Freedom River) is mainly used to determine the location information of the deep well aeration tank wellhead, providing information for later drilling sampling.
4.2.1 Detection on the east side of the plot
This time, 7 ERT lines were laid out for the key areas on the east side of the plot ( see Figure 3-2 ERT wiring diagram), including 4 in the north-south direction and 3 in the east-west direction, totaling 656 lines, with a total line length of 1298 meters, an electrode spacing of 2 meters, and the Wenner -Schlumberger Array method . The device has good resolution in both horizontal and vertical structures . The longest line ERT1 has 120 lines, the shortest line ERT3 has 86 lines , and the other lines have 90 lines . The specific results are shown in Figure 4-5 below , the results of the two-dimensional resistivity profile of ERT1 -ERT7 on the east side of the plot.


According to the ER results in the figure above , the overall resistivity of the east side of the plot is between 1 and 300 ohm – m, showing a layered distribution. The resistivity shows a ” high -low-high ” electrical distribution law in the vertical direction, which can be roughly divided into three layers. The first layer has an average depth of 0 to 1.8 meters and a resistivity of about 18 to 300 Ohm – m ; the second layer has a depth of 1.8 to 6.3 meters and a relatively low-resistance layer with a resistivity of about 1 to 30 Ohm-m ; the third layer has a depth of less than 6.3 meters and a resistivity of about 10 to 60 Ohm – m .
Combining the on-site data and resistivity medium characteristics, it is speculated that the first layer is caused by backfill soil (above the black dotted line), and the resistivity is relatively high, and the water direction changes unevenly . It is speculated that there may be gravel, construction waste, etc. in the backfill ; the resistivity of the second and third layers is relatively lower, and the overall horizontal direction is relatively uniform .
Since the eastern area of this plot is mainly used to detect obstacles such as buried pools , it was found through reference to the data that the pools built for the factory are mostly concrete structures. Combined with the geological characteristics of the plot, if there are obstacles such as pools underground, their resistivity characteristics should show a “lump or bowl-shaped” relatively high-resistance area.
Therefore, combined with the resistivity medium characteristics, it can be seen that the overall detection results have relatively lower resistivity in the second and third layers, and no “lump or bowl-shaped” relatively high-resistance anomaly areas are found in the horizontal direction. Therefore, it is inferred that there are no obstacles such as buried pools in the second and third layers. In the first backfill layer, the overall resistivity is relatively high, the horizontal resistivity changes are uneven , and there are local cluster-shaped relatively high-resistance anomaly areas, such as horizontal position 2 16-238 meters in E RT1 , horizontal positions 0-6 meters and 6 6-76 meters in E RT2 , horizontal position 0-8 meters in E RT3 , horizontal position 24-34 meters in E RT4 , horizontal position 1 26-142 meters in E RT5 , and horizontal position 0-160 meters in E RT6 . It is inferred that these anomalies may be abnormal areas (red dotted lines), but the cause of the anomaly may be the pool or the debris left over from the demolished building.
At the same time, in order to determine whether the relatively high-resistance abnormal areas in the local backfill layer mentioned above are the pool body or demolished building debris or construction waste , an on-site review was carried out on the abnormal areas. It was found on site that all the relatively high-resistance abnormal areas were debris or construction waste, not pool bodies or other structures.
Therefore, it can be seen from the results of the above figure that there are no obstacles such as buried pools on the east side of the plot as a whole, but there are a lot of gravel or construction waste in the local fill layer of the plot.
4.2.2 Detection of the location of the deep well aeration tank on the west side of the plot
This time, 6 ERT lines were laid out for the key area of the deep well aeration tank wellhead location information on the west side of the plot (see Figure 3-2 ERT wiring diagram), with a total of 480 lines and a total length of 652 meters. Since the diameter of the deep well is only 1.8 meters, a higher detection accuracy is required, so this time the electrode spacing of 1 meter and 2 meters is used, and the corresponding detection resolution is about 0.5-1 meter. And the Wenner-Schlumberger Array is used . This device has better resolution in both horizontal and vertical distribution structures, and the resolution is more sensitive. The longest survey line ZT-6 is 178 meters, and the shortest survey line ZT-1-ZT-3 is 59 meters. The specific results are shown in Figure 4-6 below. The two-dimensional resistivity profile results of the deep well aeration tank wellhead location detection on the west side of the plot. And the survey lines ZT-1, ZT-2, and ZT-3 are three parallel survey lines with a line spacing of 1 meter. ZT-5 and ZT-6 are two parallel measuring lines with a line spacing of about 1 meter. ZT-4 and ZT-6 intersect.
At the same time, the principle of wiring for this detection is to first check the original data and personnel interviews to determine the key areas (i.e., within the black dotted box in Figure 4-6 ), and then arrange the survey lines at different angles for the key areas for investigation. The structure of the deep well aeration tank is concentric, with a diameter of 1.8m and a depth of about 85m. The device is welded into a cylinder with steel plates and placed in the deep well by a crane. When the factory area is dismantled later, it is impossible to determine whether the steel plate cylinder has been dismantled and whether the well is backfilled. However, regardless of whether the steel plate cylinder of the well is dismantled or whether the well is backfilled, combined with the resistivity characteristics, as long as the formation material is found to change, its resistivity characteristics will change. Therefore, the focus of this interpretation is to analyze and determine whether the results in the area show abnormal resistivity changes, and the abnormality is strip-shaped in the depth direction with a horizontal width of about 1.8 meters.
ERT results in Figures 4-6 and 4-7 , the vertical resistivity of ZT-1, ZT-2, ZT-3 and ZT-5 in the adjusted area has no strip-like characteristics, and it is inferred that no deep well is found. However, at the horizontal position of 61 meters in ZT-4 and 97 meters in ZT-6, a “strip-like” resistivity characteristic anomaly can be seen at a vertical depth of about 9-21 meters. This anomaly splits the profile with a width of about 1.5 meters (i.e., within the red solid line frame in Figures 4-6 and 4-7 ), and the straight-line distance between the two anomalies is 0.4 meters , which is inferred to be caused by the same structure . Therefore , combined with the resistivity characteristics of the deep well aeration tank, it is inferred that the anomaly is caused by the deep well aeration tank, and the location of the well is determined from this, as shown in Figure 4-8 . It is recommended to drill a hole to verify this location , and the subsequent drilling verification was successful.


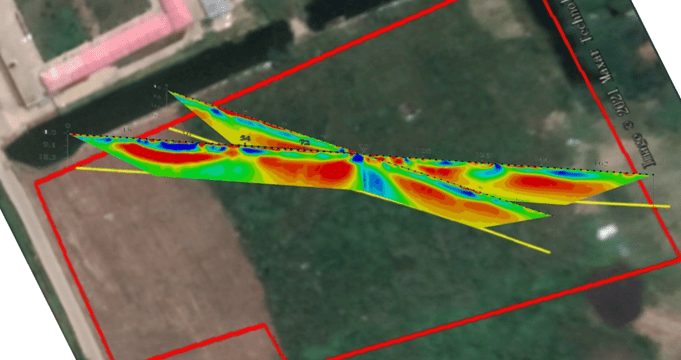
Figure 4-7 Results of two-dimensional resistivity profile detection of the wellhead position of the deep well aeration tank on the west side of Block
5 Conclusion and discussion
(1) For the detection of cables , water pipes and other pipelines, the three-dimensional radar method was used to accurately determine the location, burial depth and direction of the pipelines . The pipelines all passed from the west side of the plot to the east side, then entered the pond and passed out from the pond into the garbage transfer station.
(2) Combined with on-site investigation and detector screening, it was found that, apart from the buried water pipes and cables, there were no new pipelines or pre-buried pipelines for other municipal, gas, telecommunications or other departments within the site.
(3) The high-density resistivity method is used to detect the possible underground sewage treatment tanks and other underground obstacles. The east side of the plot (east side of the Freedom River) is mainly used to detect underground storage tanks or underground tank facilities; the west side of the plot (west side of the Freedom River) is mainly used to determine the location information of the deep well aeration tank wellhead to provide information for later drilling sampling.
(4) Seven ERT survey lines were laid out in the key area on the east side of the plot, including four in the north-south direction and three in the east-west direction, totaling 656 lines with a total length of 1,298 meters. After detection, it was found that there were no obstacles such as buried pools on the east side of the plot as a whole, but there were a lot of gravel or construction waste in the local fill layer of the plot.
(5) Six ERT survey lines were laid out in the key area of the deep well aeration tank location information on the west side of the plot, with a total of 480 lines and a total length of 652 meters. After detection, a “strip – like” resistivity characteristic anomaly was visible at a depth of about 9-21 meters in the vertical direction of survey lines ZT-4 and ZT-6, and the difference between the two locations was 0.3 meters. It was speculated that the anomaly was caused by the deep well aeration tank. It was recommended to drill a hole at this location for verification, which was successfully verified.
(6) As a pipeline measurement method, ground penetrating radar has gradually become effective in urban pipeline mapping due to its advantages of being fast, accurate, and requiring no excavation. With the use of three-dimensional radar, data acquisition uses differential GPS + Doppler radar ranging for positioning, and the radar image can also be “sliced” in different directions, which can accurately analyze the location and direction of underground cables, and the three-dimensional results are more three-dimensional.
(7) The high-density electrical method is particularly sensitive to the resistivity characteristics of structures. When there are structures distributed underground, the layered characteristics in the resistivity image are destroyed, and strip-shaped or elliptical color blocks appear. It can well distinguish the distribution of surrounding rocks and structures, and is an indispensable means in engineering surveys such as urban strata.
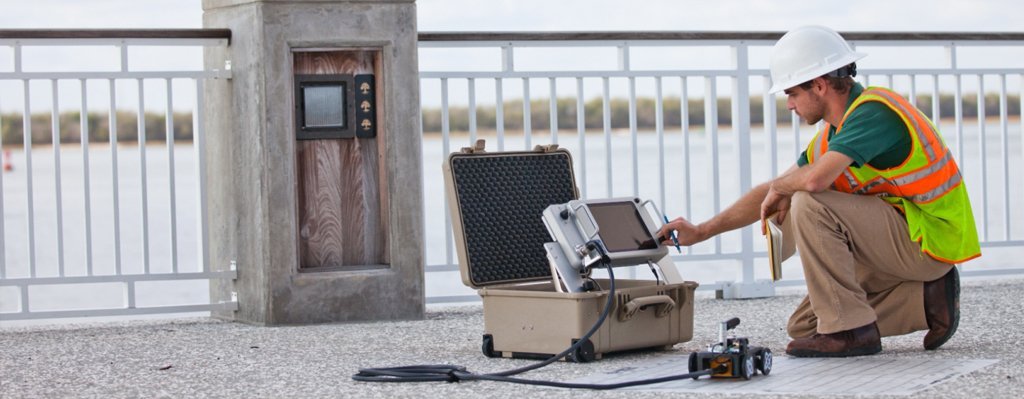
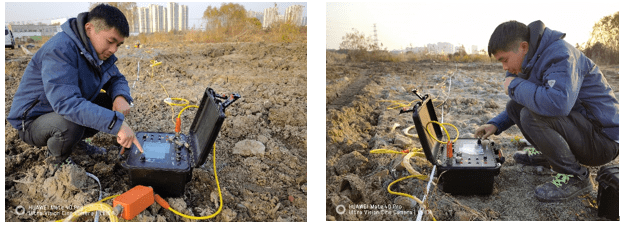
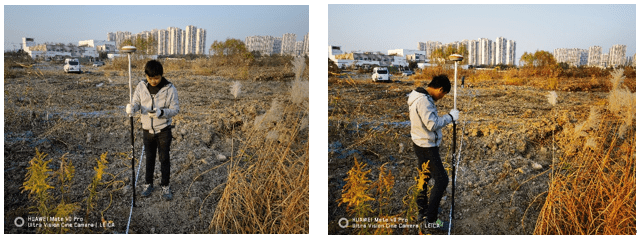
6 Some field work photos

FAQ
What is the main difference between a single tap and a double tap?
What is the principle of high-density electrical prospecting?
What are the advantages of high-density electrical method?
In what fields is the high-density electrical method generally used?
What are the application characteristics of high-density electrical method?