Welcome to Geotech!
【WGMD-4】Application of geological disaster landslide investigation
Description
Ⅰ.Introduction
Geophysical exploration using two Dimensional (2D) electrical resistivity tomography (ERT) survey plays a significant role in determining the subsurface resistivity distribution by making measurements on the ground surface. From these measurements, apparent resistivities are recorded during the fieldwork, which are later converted to true resistivity using appropriate computer software. These true resistivities are then converted to subsurface geological condition. The 2D electrical resistivity profiling is capable of detecting boundaries between unconsolidated materials (overburden), rocks, identifying weathered rock from fresh rock and contact between rocks of different lithology.
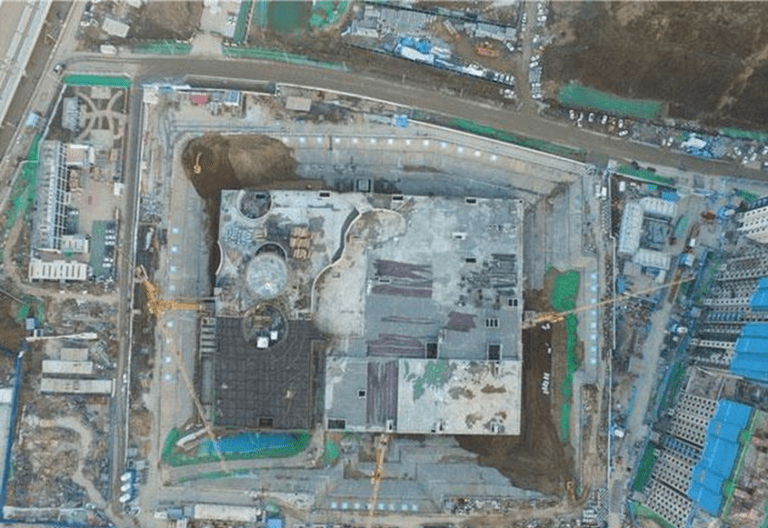
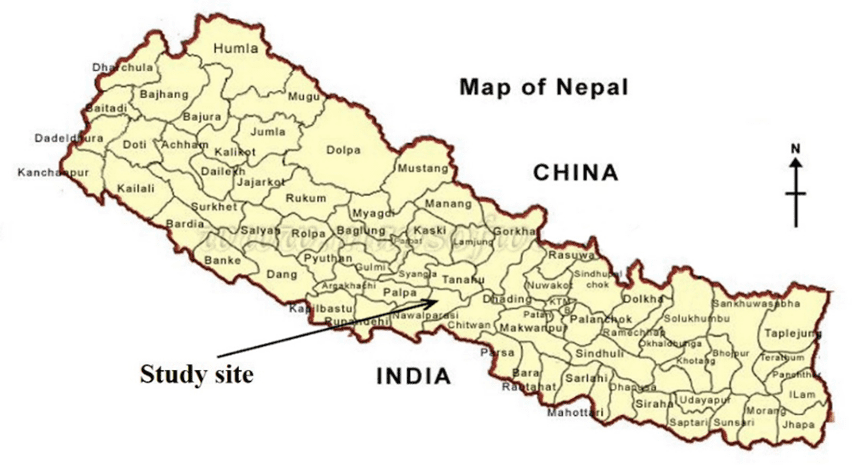
The Kerunga landslide site is located about 14.3 km NW form Kawasoti, 24 km along gravel and earthen road connecting Mahindra highway from Daldale. The landslide located at Hupsekot V.D.C, ward -5, Kerungatol of Nawalparasi district. The location of project sites are shown in Figure.
Ⅱ.Objective of study
The main objective of the proposed study consists of mapping vertical as well as horizontal variations of electrical resistivity to enable detection of the boundaries between unconsolidated materials and rocks of the different resistivity. The objectives of the survey are as follows:
- Depth of various types of rock masses.
- Thickness of the overburdens colluvial /alluvial soil and river bed materials, if they are thick.
- Quality of the bedrocks occurring below the overburdens.
- Weak zones: Fractured zone, local fault zone, shears zones etc and propogation towards Ramche village.
- Ground water bearing formations etc.
Ⅲ.Investigation method
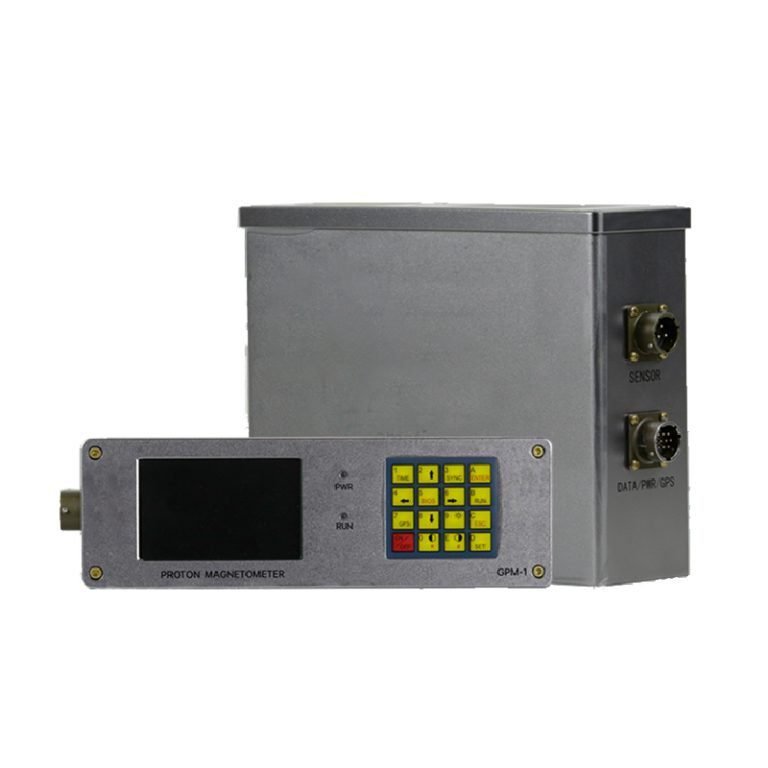
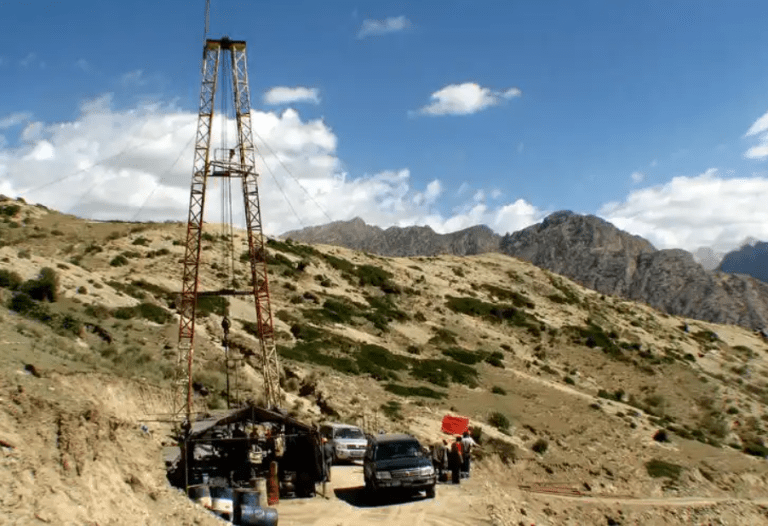
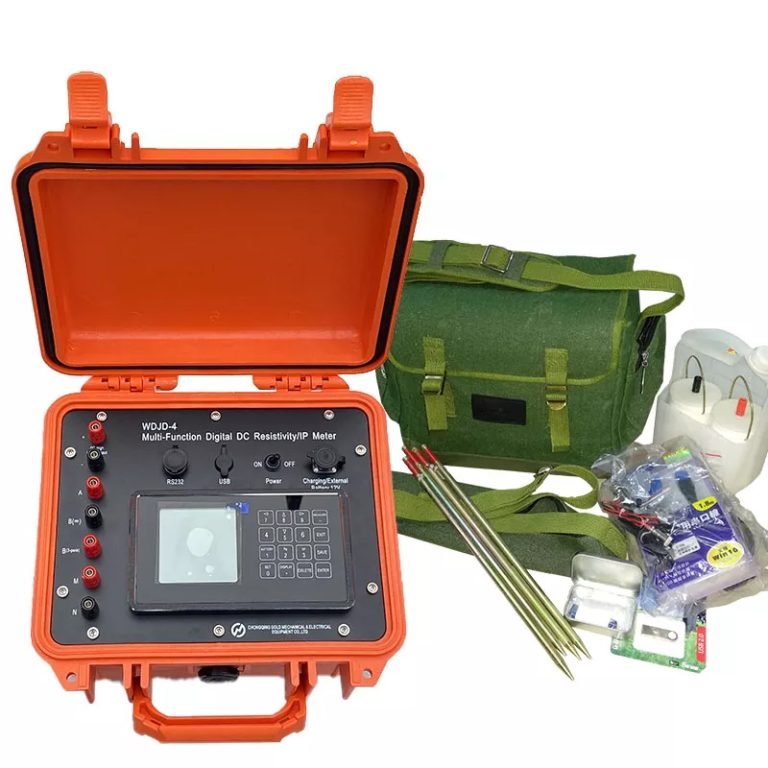
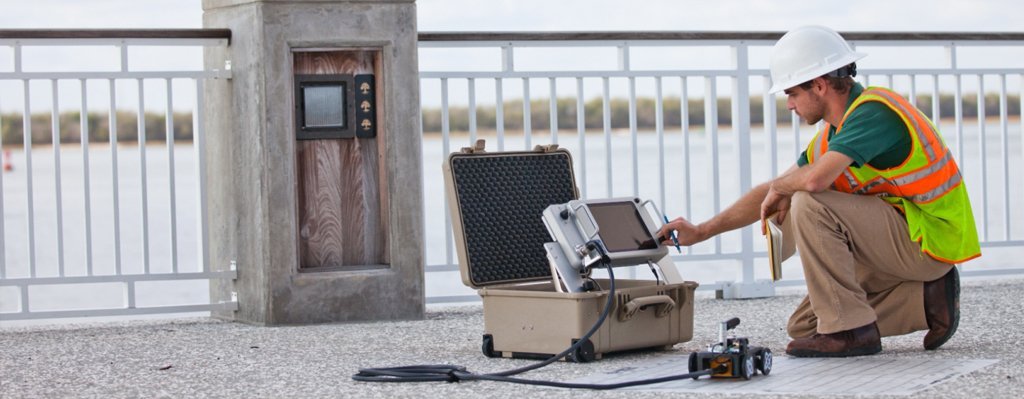
To fulfill these proposed objectives, this project uses Geotech’s WGMD-4 Distributed High-density Electrical Method System. Right flank of landslide areas was mapped by six 2D ERT profiles covering 1,400 m length. These ERT layout plan are shown in Figure 2. The field crew and ERT survey in operation are shown in Figure 3. The positions and lengths of the profiles were determined based on the geological and engineering geological condition of the present sites.
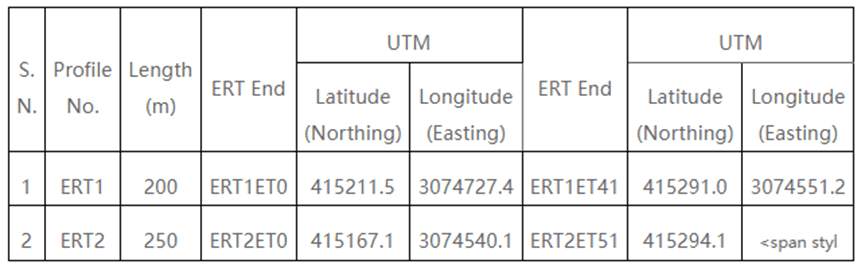
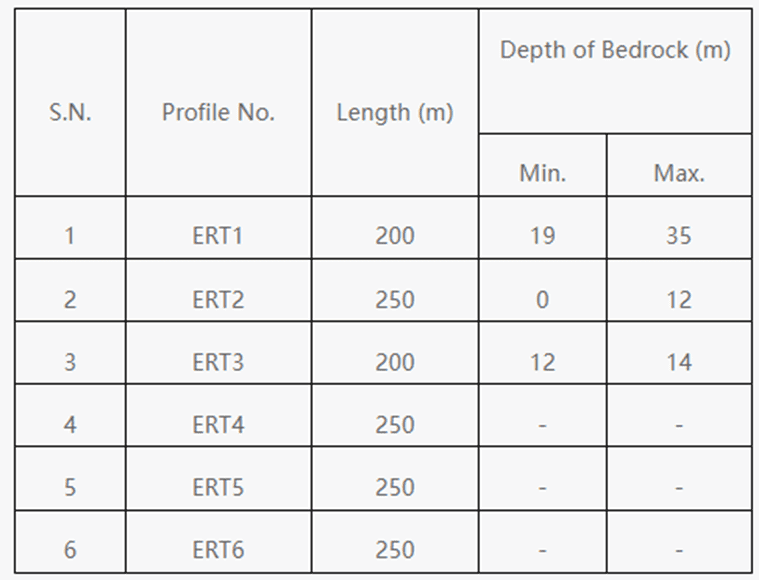
The depth of investigation depends on the length of the profile. To collect information from the depth of about 35 m, a full length of profile is required, which is 51 electrodes spacing times 5 m and is 250 m. If profile length is 200 m, there is length for only 41 electrodes instead of 51 electrodes. Such survey will give result from a depth of the order of 20-25m only. Hence to maintain depth of about 20-25 m from ground surface, survey was conducted using appropriate lengths of profile. The field work was started on 8th April 2018. The crew returned to Head Office Kathmandu on 16 April, 2018 after completing the data acquisition in the field. Total actual ERT coverage for sixteen profiles is 1,400 m. The details of 2D ERT coverage are tabulated in Table 1.
Ⅳ.Interpretation of electrical resistivity tomography
Electrical resistivitiy of rocks
Electrical resistivity of the rocks or sediments depends on the resistivity of the rock mineral matrix and the fluid contained in its pore spaces. Rocks are composed primarily of quartz, feldspar and mica or other silicate minerals, which are poor conductors. They contain water in the pores, which is usually a better conductor. Thus the resistivity of, say, sandstone, generally depends on geometry of its pore spaces and the resistivity (or salinity) of its contained fluid. As permeability and porosity decrease, resistivity usually increases, when there is no change in formation fluid. The resistivity also depends upon the age of the rock or sediment as, with age, they become compacted and/or weathered. Compacted rocks show very high resistivity compared to unconsolidated sediments like clays, sands, gravels and so on as there will be less fluid in it. The weathered rock shows low resistivity when there is presence of water in it. Dry rocks or sediments have very high resistivity (of the order of 10,000 to 100,000 Ohm-m), whereas water bearing rocks or saturated sediments become much less resistant (10 to 1,000 Ohm-m).
Resistivity tomography
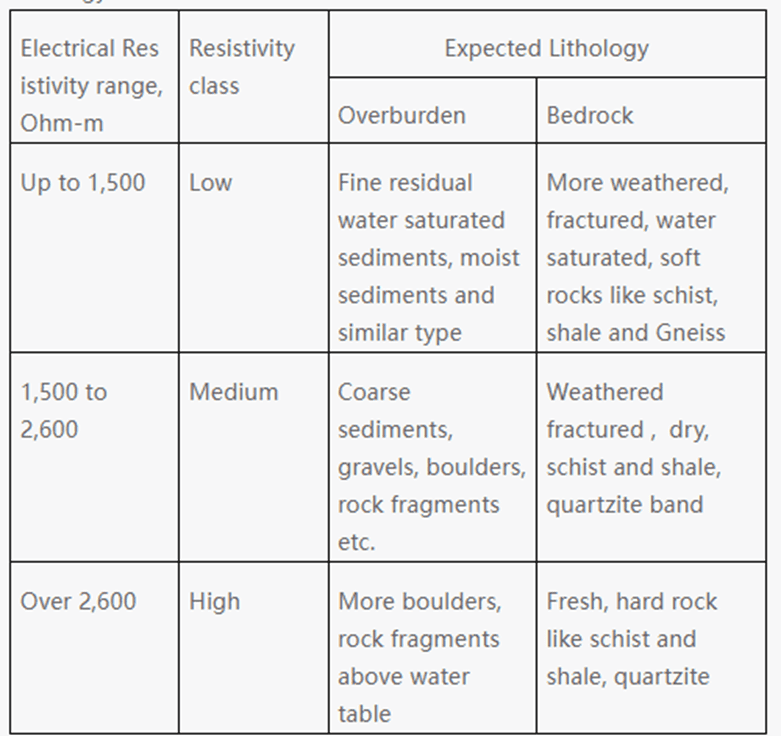
The field data were filtered, processed and treated with the software, RES2DINV. The software inverts the field data and calculates the appropriate model in term of resistivity and provides output in the form of resistivity contours. This inversion data is used to draw up the lithological and geological information. The basic principle behind the relation between resistivity data and lithology/geology are already dealt with in above sections. In the conversion from resistivity data to lithology following table (Table 3) has been used. This correlation table has been prepared based on the local geological information and experience with similar works in other parts of the country. However, it should be noted that the resistivity of certain lithology has wide variation and the following table (Table 3) is just an approximation. These inversion results showing resistivity model of all six profiles are presented in Figure 6 to 11 and are attached. The sections are prepared as per topographic undulations, as the electrodes are fixed at each 5 m slope distance (not horizontal distance or plan distance). Hence though it looks more distance in section, they actually are shorter in plan. The maximum and minimum thickness of overburden in each profile is tabulated in Table 4.
ERT InterPretations
Altogether six ERT profiles were surveyed at right flank of Kerunga Landslide. These ERT profiles are shown in Figure 6 to Figure 11 in the following section. The 2D ERT results are discussed below for each profile.
Lithological section of ERT 1
This profile located at right flank of Kerunga landslide parallel to slide axis. ERT1 profile crosses ERT 2 profile at obtuse angle at chainage of 80 m and total run of this profile is 200 m have thickness of 37 m. The 2D ERT result and lithology are shown in Figure 6.
There is low resistivity contours which covers top part of the entire profile length, indicates presence of moist and saturated residual soil with fragments of shale, which may be due to presence of subsurface water channel and stream at chainage 145 m. The thickness of this saturated overburden layer ranges from 15 m to 37 m throughout the profile. The under laying second layer from chainage of 45 m to 200 m with medium resistivity value denotes presence of weathered shale and quartzite. Thickness of this layer ranges from 3 m to 18 m.
The existence of very high resistivity value from chainage 80 m to 180 m indicates presence of quartzite bed at the bottom part of the profile. Thickness of this profile ranges from 2 m to 18 m.
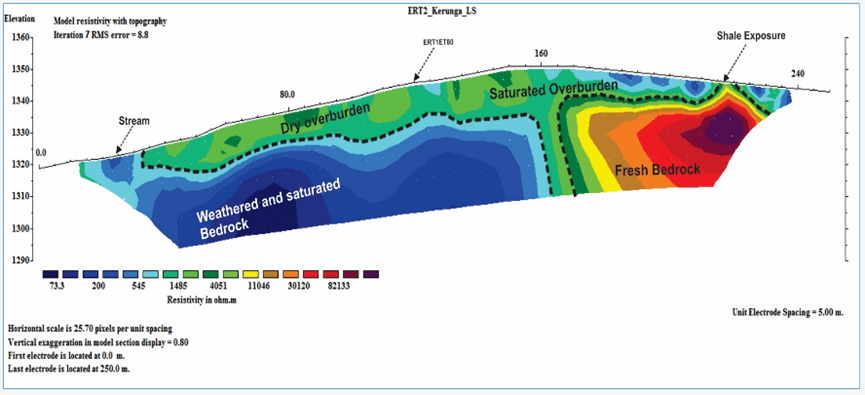
Lithological section of ERT 2
This profile located at right flank of Kerunga landslide perpendicular to slide axis. ERT2 profile crosses ERT 1 profile at acute angle at chainage of 120 m and total run of this profile is 250 m have thickness of 37 m. The 2D ERT result and lithology are shown in Figure 7.
There is low to medium resistivity contours at the top part of the profile indicates presence of water saturated to moist residual soil with fragments of shale from chainage 30 m to 250 m, thickness of this layer ranges from 1 m to 37 m. Low resistivity counters from chainage 10 m to 155 m underneath top layer indicates water saturated zone or subsurface water channel with thickness 20 m to 37 m. There is presence of stream at change 25 m chainage may have contributed.
Lithological section of ERT 3
This profile located at right flank of Kerunga landslide perpendicular to slide axis. ERT4 profile crosses ERT 3 profile at chainage of 85 m and total run of this profile is 200 m have thickness of 37 m. The 2D ERT result and lithology are shown in Figure 8.
There is low to medium resistivity contours which entirely covers profile run at the top part, indicates presence of water saturated to dry residual soil with fragments of shale and quartzite. Very low resistivity patches of resistivity value at chainages 0 m to 80 m and 160 to 200 m indicates water saturated zone as observed in field. Low resistivity patch at chaingae 85 m to 110 m indicates subsurface water channel which may have disintegrated surrounding bedrock. The thickness of this overburden layer ranges from 12 m to 37 m. The under laying second layer from chainage 0 m to 80 m and 90 m to 180 m with medium resistivity value denotes presence of weathered shale and quartzite, which envelopes fresh bedrock. Thickness of this layer ranges from 2 m to 10 m.
The third layer is marked by high resistivity contours form chainage 0 m to 75 m and 105 m to 150 m, suggests presence of hard, fresh quartzite and shale. Thickness of this layer ranges from 25 m to 23 m.
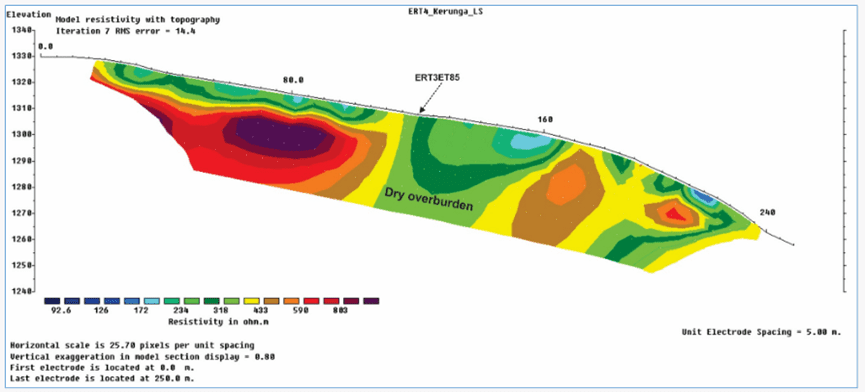
Lithological section of ERT 4
This profile located at right flank of Kerunga landslide parallel to slide axis. ERT3 profile crosses ERT4 profile at chainage of 120 m and total run of this profile is 250 m with thickness of 37 m. The 2D ERT result and lithology are shown in Figure 9.
There is low resistivity contours which covers profile length, indicating presence of moist and saturated to moist residual soil with fragments of shale. Bedrock may have been totally disintegrated in to soil with fragments of shale and quartzite as observed in field.
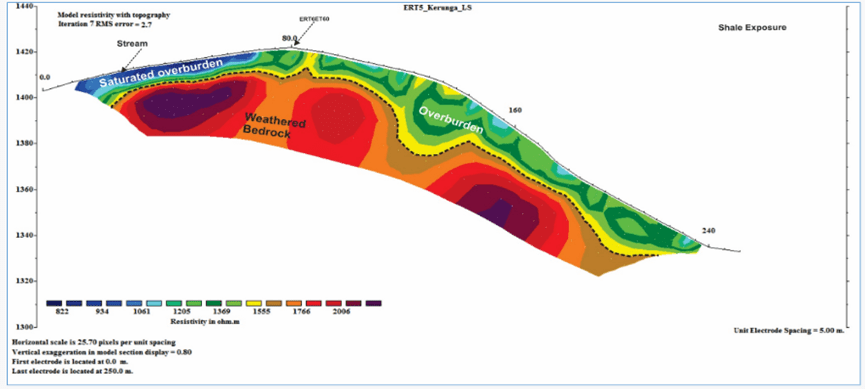
Lithological section of ERT 5
This profile located at right flank of Kerunga landslide perpendicular to slide axis. ERT6 profile crosses ERT5 profile at chainage of 80 m and total run of this profile is 250 m with thickness 37 m. The 2D ERT result and lithology are shown in Figure 10.
There is very low resistivity contours which covers top part of the entire profile length, indicates presence of saturated residual soil with fragments of shale from chainage 0 m to 70 m of profile length, which may be due to presence of nearby stream (Figure 2). Presence of moist residual soil from chainage 70 m to 250 m is demarked by low resistivity contour. The thickness of top overburden layer ranges from 8 m to 20 m throughout the profile. The under laying second layer with medium resistivity value denotes presence of weathered shale and quartzite throughout the profile. Thickness of this layer ranges from 17 m to 25 m.
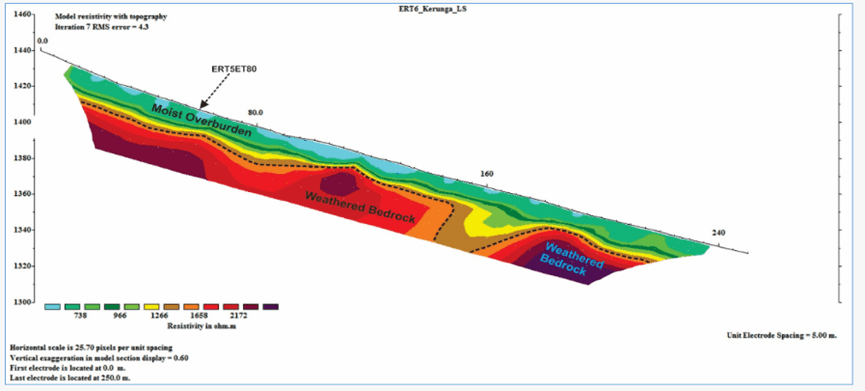
Lithological section of ERT 6
This profile located at right flank of Kerunga landslide parallel to slide axis. ERT5 profile crosses ERT 6 profile at chainage of 60 m and total run of this profile is 250 m with thickness of 37 m. The 2D ERT result and lithology are shown in Figure 11.
There is low resistivity contours which covers top part of the entire profile length, indicates presence of moist and saturated residual soil with fragments of shale. The thickness of this top overburden layer ranges from 15 m to 37 m throughout the profile. The under laying second layer from cahinage of 0 m to 155 m and 160 m to 250 m with medium resistivity value denotes presence of weathered shale and quartzite. Thickness of this layer ranges from 18 m to 22 m.


Ⅴ.In conclusion
In total, 6 ERT profiles were surveyed at right flank of Kerunga landslide covering 1400 m. Thick to thin layer of residual soil with fragments of shale and quartzite blanketed over survey length. Moist to saturated overburden with subsurface stream channel is frequently observed in ERT profiles. The thickness of these overburden vary from few meters to 37 m. Rock is found to be very weak class and deeply weathered due to presence of water and low strength. The main conclusions are listed below:
(1)Rock and soil at left flank of Landslide found to be weak and disintegrated up to residual soil.
(2) Most of the surveyed area rarely consist of fresh rock up to ~ 40 m depth, covered by weathered zone.
(3)Water from surface and subsurface channel found to be main cause of disintegration of rock mass. Which may be the main cause of landslide propagation.
(4)ERT1 and ERT2 profiles shows that presence of subsurface water saturated zone and subsurface water channel.
(5) ERT3 profile shows gradual disintegration of bedrock due to water channel.
(6)ERT4 profile made up of totally weathered rock in-situ.
(7)The rock at the top part of landslide found to be totally weathered as indicated by ERT5 and ERT6.
These conclusions are obtained from indirect method and should be correlated with drilling results to arrive at the overall geological conclusions.
Further reading | Technical solutions related to this article
In the field of resource exploration and engineering testing, accurate data is the key to success. As an innovator of resource and environmental instruments, Geotech has always taken high-precision electrical exploration technology as its core to provide reliable solutions for global users.
If you want to learn more about how the [Electrical Exploration System (ERT)] can help mineral exploration and geological research, please click on the electrical instrument product page to explore details, or visit Geotech’s official website to view the full range of exploration equipment (covering more than ten categories of products such as magnetometers, seismic nodes, and geological radars). Our technical team is on call at any time to customize scientific solutions for your project – making unknown strata a controllable data map.
FAQ
What is the main difference between a single tap and a double tap?
What is the principle of high-density electrical prospecting?
What are the advantages of high-density electrical method?
In what fields is the high-density electrical method generally used?
What are the application characteristics of high-density electrical method?