Welcome to Geotech!
【WGMD-4】Application of Electrical Resistivity Tomography (ERT) Method in Borehole Tests in Tajikistan
Description
Ⅰ.Introduction
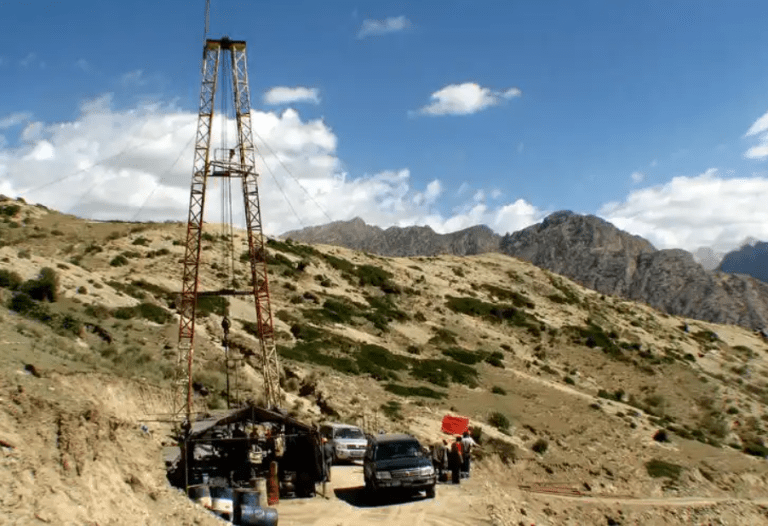
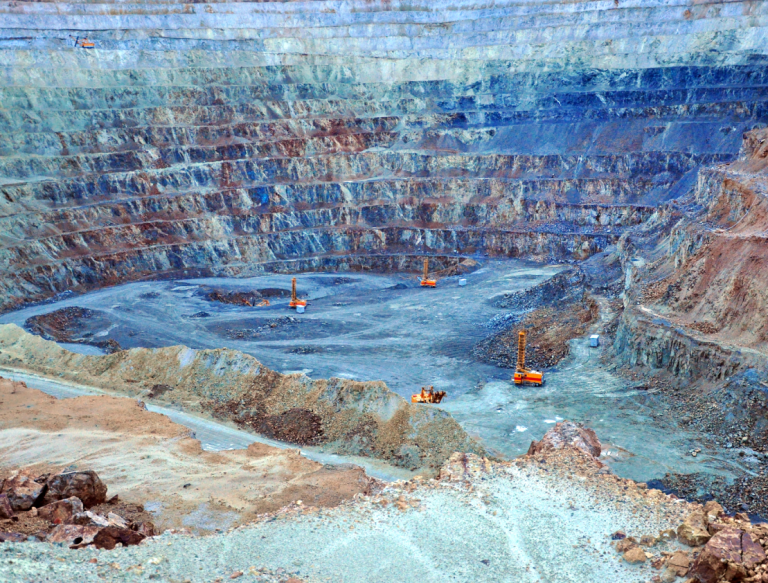
The local climate in Tajikistan is highly variable, and soil salinization and alkalization are extremely severe. This has led to scarce natural vegetation along the entire river. The situation also contributes to river dam problems and serious soil erosion. The local land mainly consists of soft soil, with numerous stones of various sizes. Soil slides occur frequently at the site. In the plane, except for the soft clay and reinforced materials previously used in infrastructure layout, the surrounding area is reinforced and rigidly fixed with soft soil engineering materials. The layout is mainly in horizontal and surface forms.

Ⅱ. Purposes of project implementation
(1)To comprehensively understand the underlying structure of the entire plane, which is crucial for facilitating the selection of late – stage mining equipment and formulating work plans.
(2)To precisely define the location of rock – layer cracks predicted by experts. This information provides valuable support for the repair project.
Ⅲ.Survey method
Electrical Resistivity Tomography (ERT) Method:The contrast between the physical properties of chargeability and resistivity of the environment involved makes it possible to delimit the deposition environment to identify the area of accumulation of the gold ore, making it possible to identify potential potential sources through drill holes.
They provide a true “tomography” of the subsoil, providing essential information for the prospects.
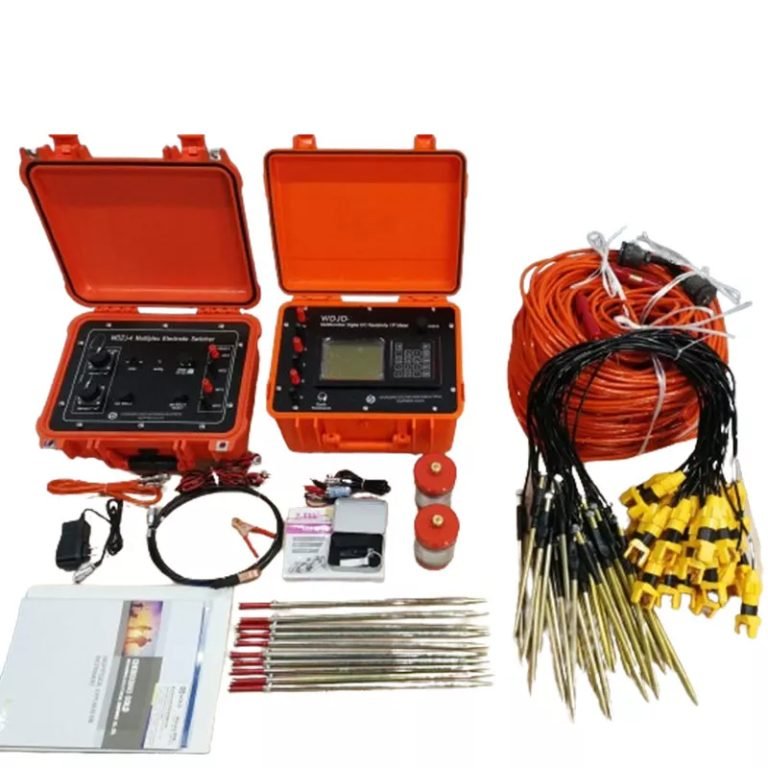
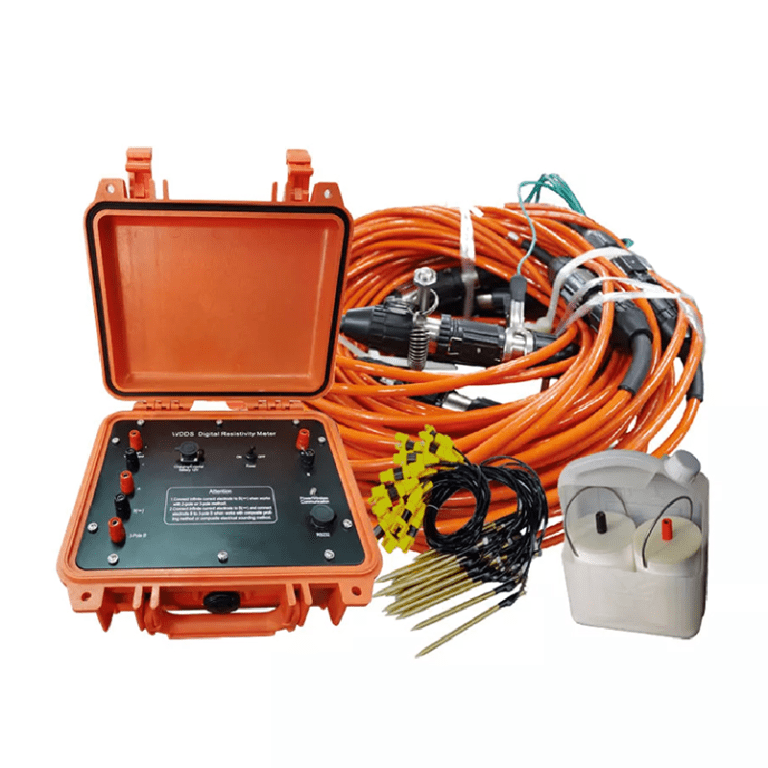
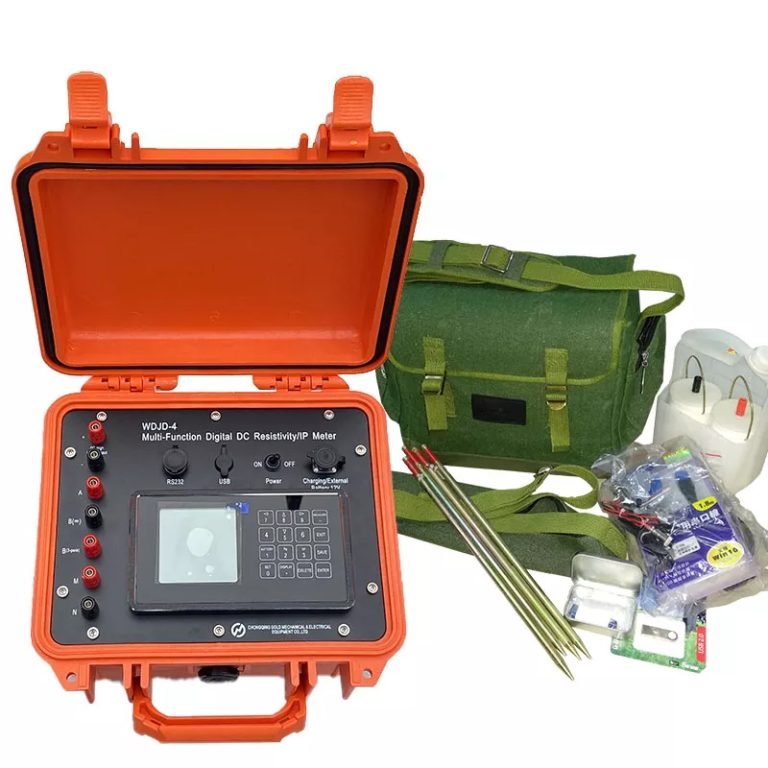
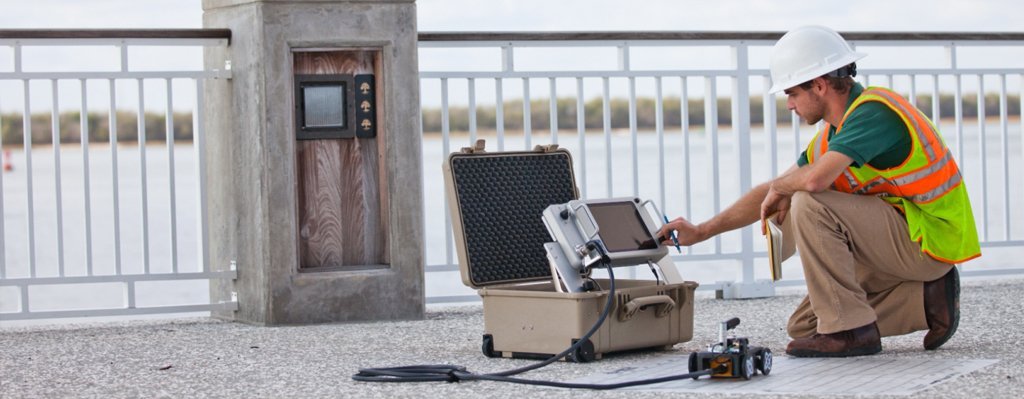
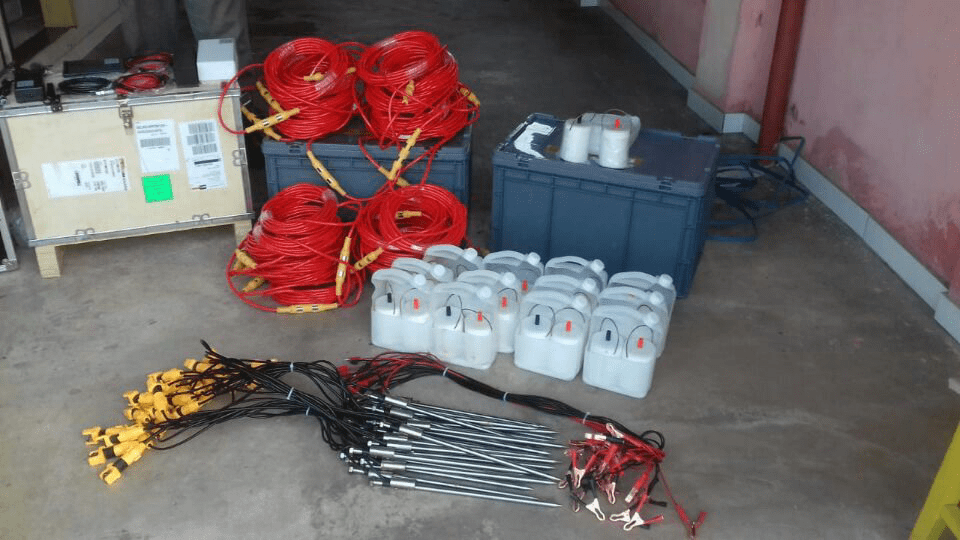
Ⅳ.Equipment
The survey mission used Geotech’s WGMD-4 centralized high-density electrical method system【Electrical Resistivity Tomography (ERT) Method】, with 24 non-polarized electrodes in the area where the metal ore exists.

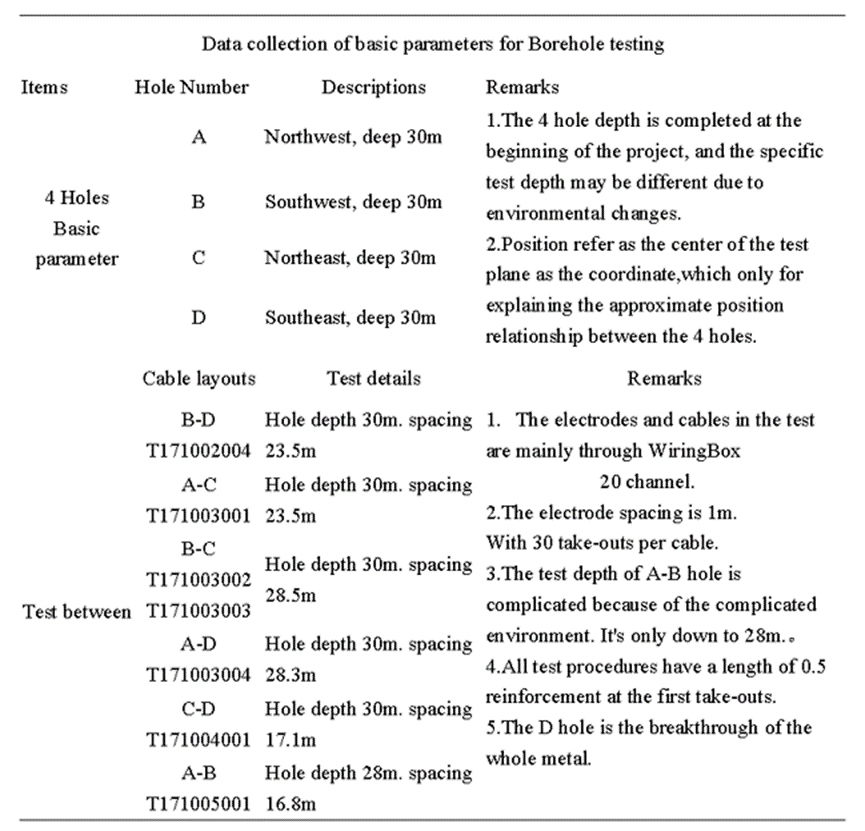
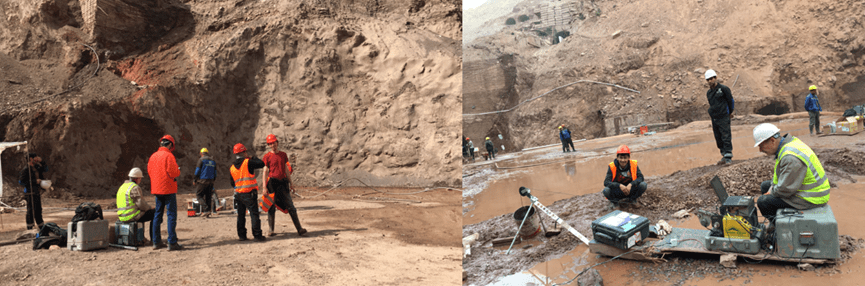
Ⅴ.Project implementation
Details of test Process:
Ⅵ. Analysis of the Results
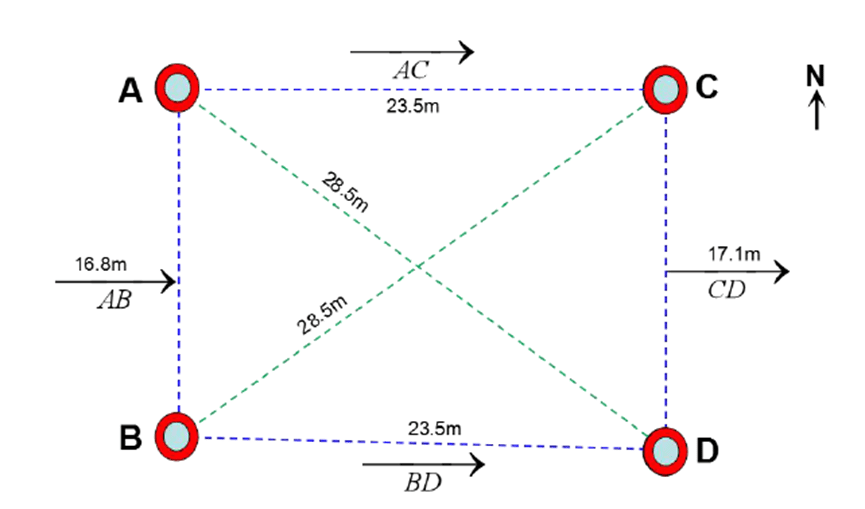
Analysis of the Results of 4 – Holes Test Data under the Electrical Resistivity Tomography (ERT) Method.
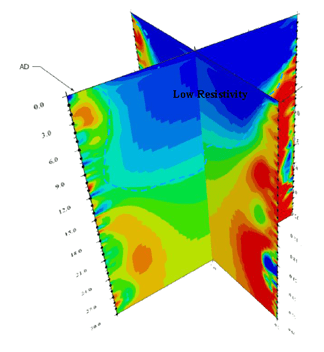
The area around the test site is composed of gravel and soft soil, resulting in a relatively high resistivity reaction in the formation. When measured in rainy conditions or areas with surface water, the surface shows relatively low resistivity. If there are cracks, the low – resistivity water can penetrate, which helps to distinguish fractures from the rock.
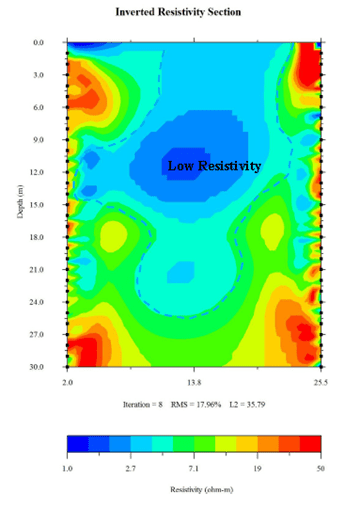
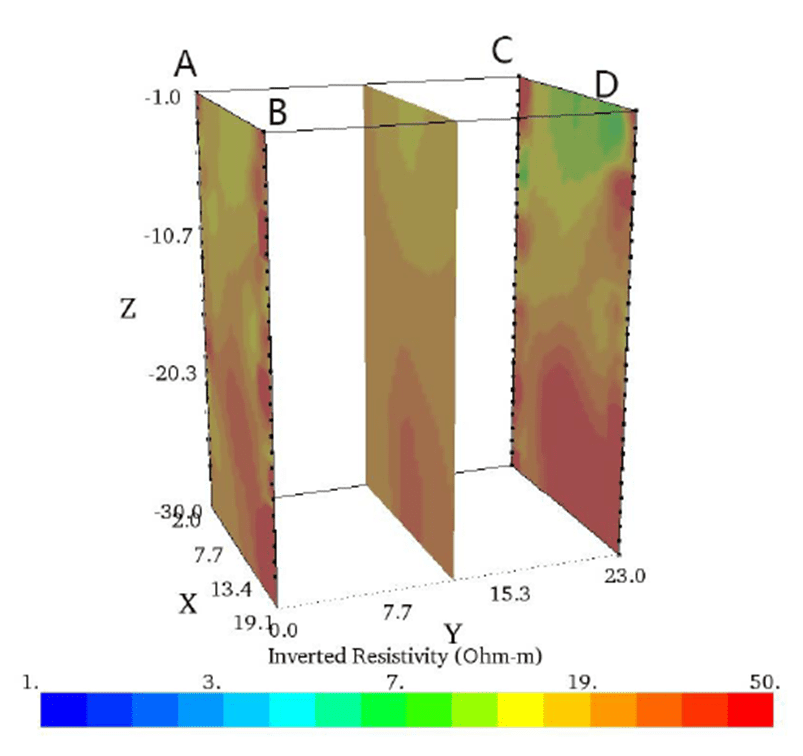
The surface profile of the AC section of around 0~1 meters are the low resistivity layer with the value is 1~5 ohmm.Extending from the surface to the depth of 15 meters, the depth of 24 meters(some partial). At a depth of 24.5 meters, the local high resistivity value is 16 ohmm.The surface profile of the BD section around 0~14meters are low resistivity layer, the depth of the section is 15.5 meters high resistivity.
The surface profile of the BC section around 0~11 meters are low resistivity layer, the depth of the section is 16 meters high resistivity. The surface profile of AD section around 0 to 15.5 meters are low resistivity layer, the depth is 24 meters high resistivity.
The 0~9 meter surface of the CD profile is a low resistivity layer with a depth of 14 meters and a high resistivity. Line AB section depth 11 meters high resistivity.
According to the present profile data:
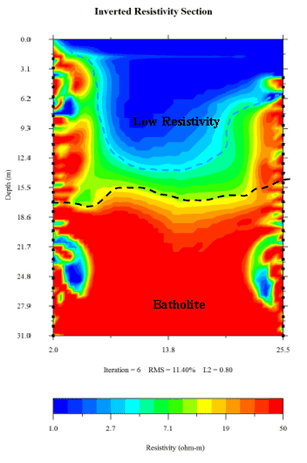
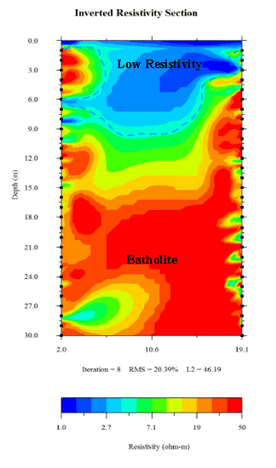
- The low resistivity layer on the surface layer from 0 to 1 meter, with a value of 1 – 5 ohm – m, is caused by surface water infiltration.
- Below 1 meter in depth, the low resistivity of water is caused by cracks.
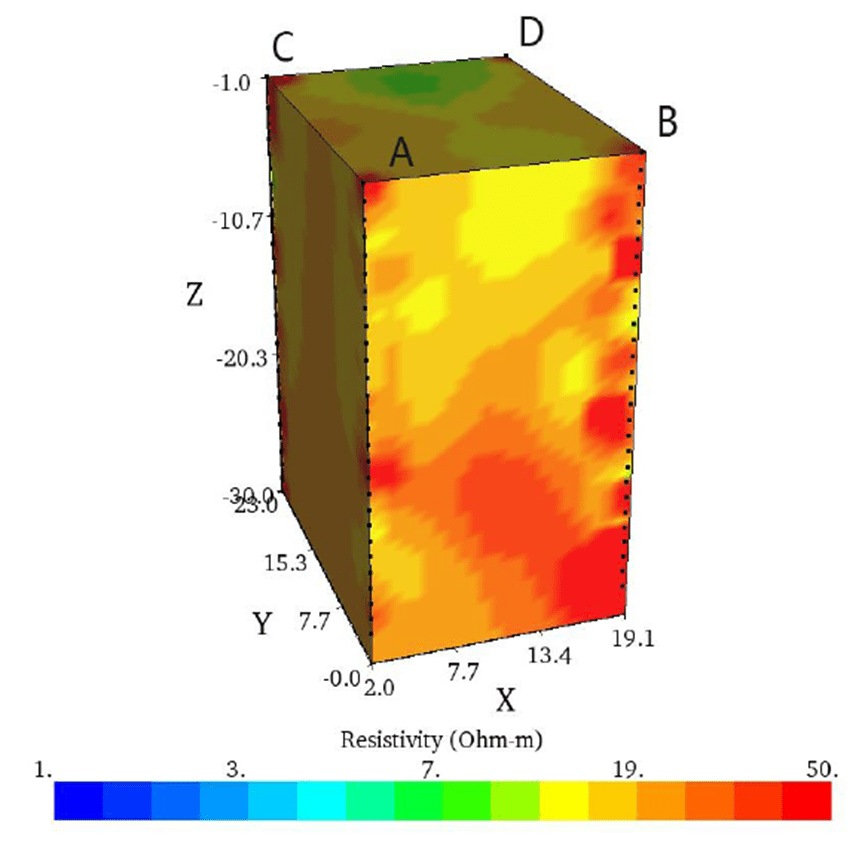
- Near the surface, the local high resistivity in the line is led by the artificial cement in the surface layer. At a depth of 15 meters, the high resistivity value of 16 ohm – m is deduced to be related to rock.
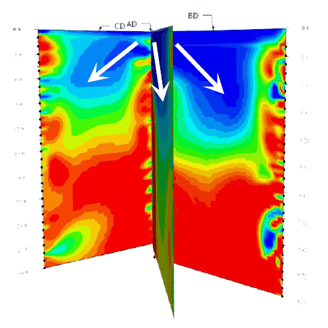
As a result, in the directions of A→D, B→D, and C→D:
- Both the C hole and D hole are in lower resistivity areas.
- The trend of low resistivity extends continuously from the C hole and D hole towards A and B.
It is confirmed that:
- The middle zone of the 4 holes is a low resistivity block. It may be a temporary water layer caused by the original temporary water layer or fissure.
- The A→D and B→C lines can confirm that the middle zone of the well is a low resistivity area.


For more information about Electrical Resistivity Tomography (ERT) principles, please refer to the following article for more information.https://geotechcn.net/service/geophysical-methods-a-comprehensive-guide-to-electrical-resistivity-tomography-ert/
FAQ
What is the main difference between a single tap and a double tap?
What is the principle of high-density electrical prospecting?
What are the advantages of high-density electrical method?
In what fields is the high-density electrical method generally used?
What are the application characteristics of high-density electrical method?