Welcome to Geotech!
Electrical Instrument Solution:High-density resistivity method for landfill environmental monitoring solutions
Description
Overview
With the development of economy, domestic waste landfills are facing the problem of leakage pollution. In order to solve this problem, it is necessary to determine the leakage location and conduct dynamic monitoring. Among them, monitoring is to find leakage in time and repair it, while detection is to conduct detailed detection at known locations or leakage areas to determine the leakage location and the form and scope of pollution diffusion. High-density resistivity method is a commonly used detection method with the advantages of fast, low cost, large sample, rich information and real-time dynamic monitoring. This work used the high-density resistivity method to detect the landfill, characterize the spatial form of the surrounding rock boundary, bottom boundary and landfill body, and the analysis results showed that there was no leakage in the measurement area.
Ⅰ.Instruments and equipment
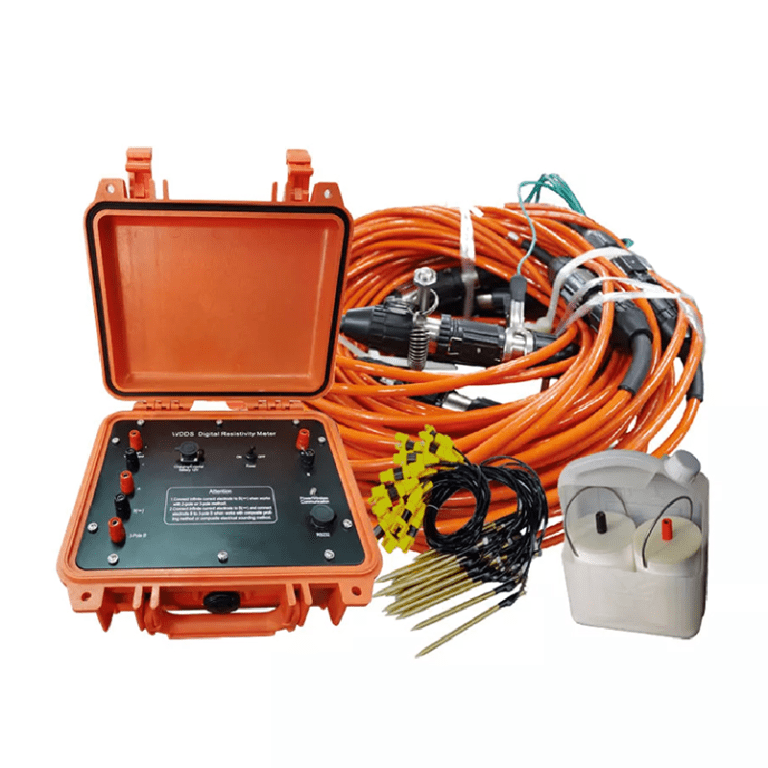
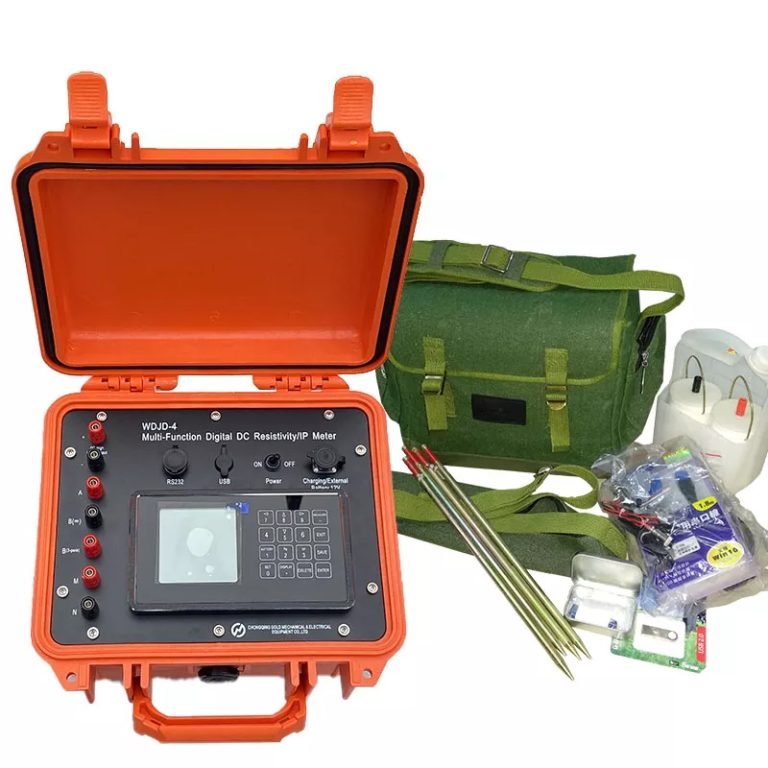
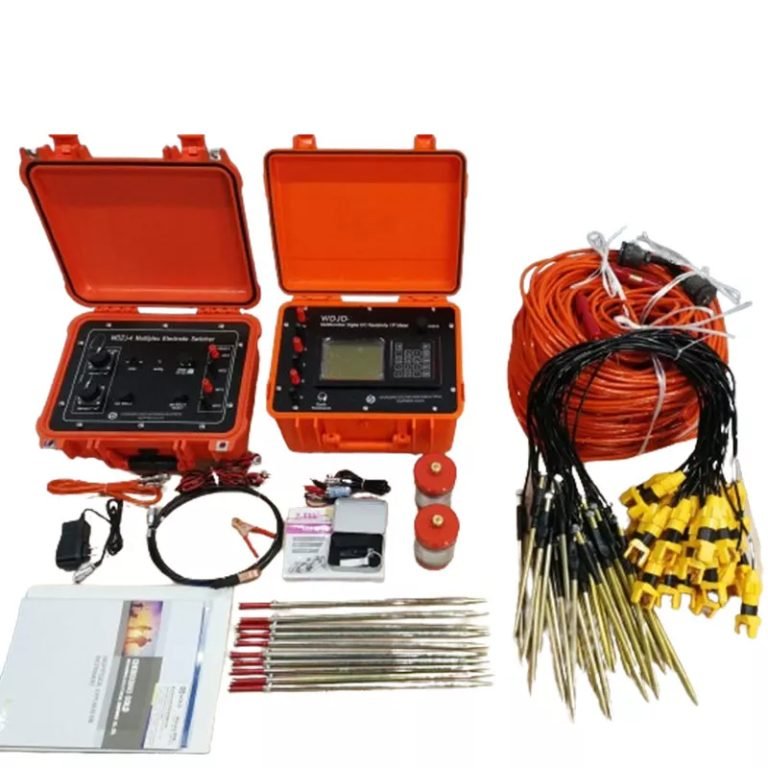
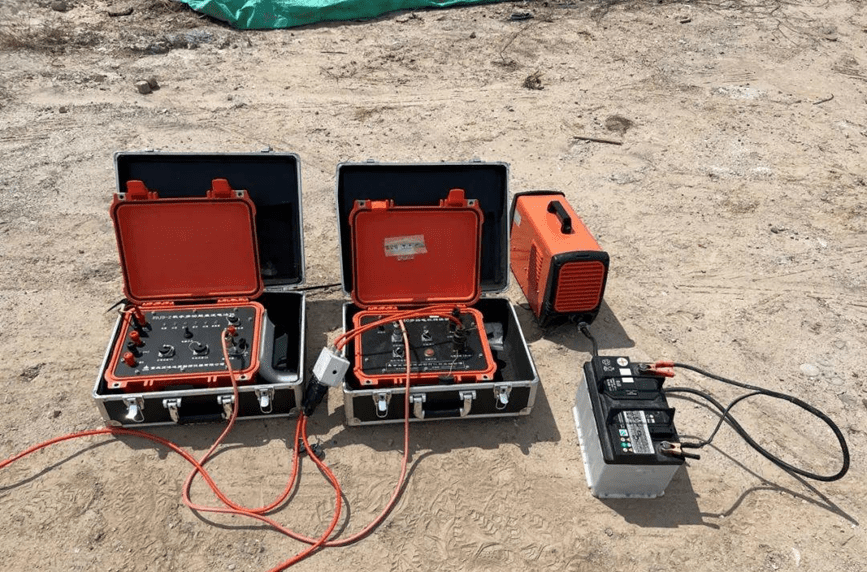
The measurement equipment used in this measurement is Geotech’s WGMD-10X 10-channel centralized high-density electrical measurement system.
Main features of the WGMD-10X 10-channel centralized high-density electrical measurement system: The system uses fully digital automatic measurement, can automatically compensate for natural potential, drift and electrode polarization, and supports cascade expansion of electrode converters, which can be expanded to up to 300 channels.
Ⅱ.Principle of high-density electrical method
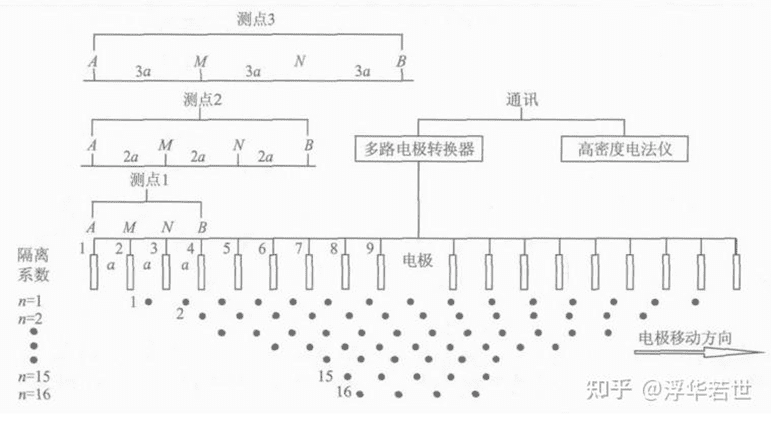
The high-density electrical method adopts an array exploration method. It is an electrical exploration method based on the difference in apparent resistivity between rocks and ores. It studies the resistivity difference anomalies between underground media. The distribution of underground stable current field is measured in two-dimensional space. During measurement, multiple electrodes are laid out at one time. These electrodes are arranged in a straight line with a fixed spacing (see Figure 2). Each electrode is both a power supply electrode and a measuring electrode. Different electrode combinations and different electrode spacings are selected through a programmable multi-channel electrode converter to complete the rapid collection of field data.
Ⅲ.Characteristics of landfills (leakage)
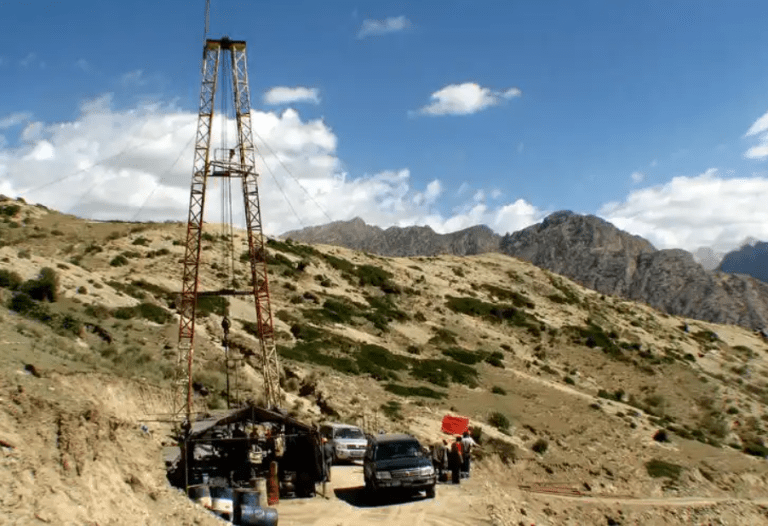
Landfills are mostly located in low-lying areas or remote ravines, where garbage is directly dumped. The bedrock of the landfills often has fractured zones or joint-dense zones of varying degrees along the ravines, or there are permeable layers. Under the leaching effect of atmospheric rainfall, pollutants seep into the bottom of the landfill. Once the anti-seepage treatment at the bottom of the site does not meet the standards, it will lead to leakage pollution in the landfill, which will bring many environmental problems and hidden dangers to people’s drinking water safety.
The leakage contaminated liquid enters the underground leakage channel from the leakage point and spreads outward. The leakage channel is often an underground fractured zone, joint-dense zone or permeable layer connected to the leakage point. The seepage direction is mostly downstream of the landfill. The leakage diffusion speed is related to the hydraulic gradient, permeability coefficient and hydrodynamic diffusion coefficient. Therefore, the rainy season is a serious period of leakage pollution.
Ⅳ.Analysis of actual detection results
Three high-density electrical survey lines were arranged for this work (Figure 3). The apparent resistivity cross section of the two-dimensional profile, the measurement parameters are the Wenner device: point spacing 3m, 60 electrodes, measuring line length 177m, maximum isolation factor 19, 570 effective measuring points in the cross section, DC power supply voltage 400V. As can be seen from the interpretation and analysis of each measuring line in Figure 4, the high-density electrical method can accurately depict the resistivity morphology of the surface cover soil, boundary surrounding rock sandstone and landfill within the measurement range.
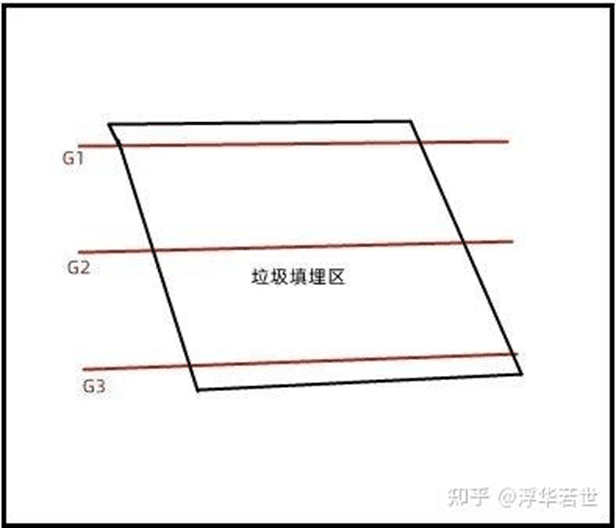
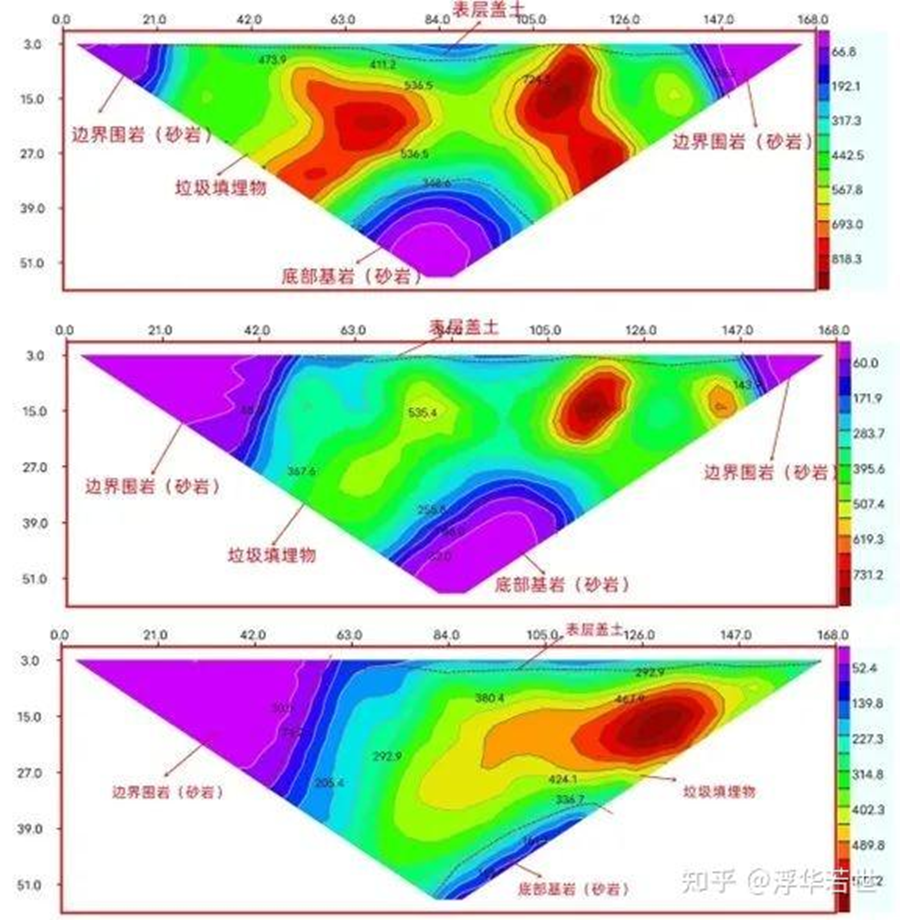
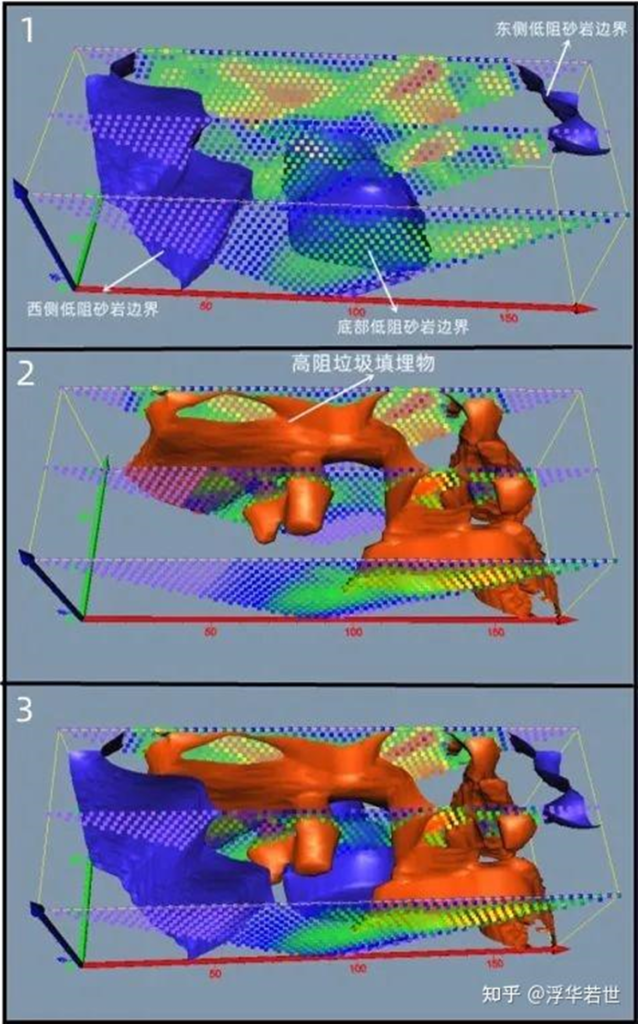
Since the three survey lines are parallel and spaced at the same distance in space (line spacing 40m) and their starting points are located at the same vertical position, the three survey lines can be customized in space. Then, the volxer software can be used for three-dimensional visualization to show the three-dimensional spatial shape of the measured target. The low-resistance (blue) contour surface represents the boundary of the landfill, and the high-resistance (red) contour surface represents the abnormal shape of the landfill area (Figure 5).
Ⅴ.Establish model analysis detection
1.Two-dimensional profile model
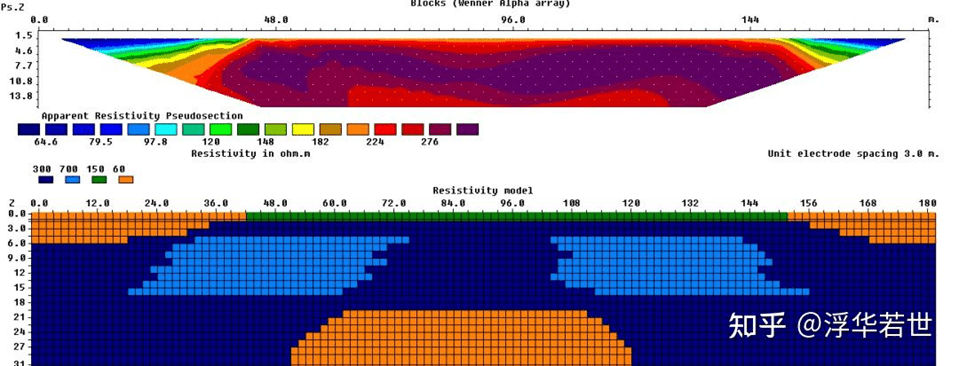
Using G1 line as an example of interpretation results, a two-dimensional profile model is established to analyze the accuracy of the actual detection results. The forward model is established using res2dmod software. The parameters are: background field value is 300Ω·m, surrounding rock resistivity (bottom bedrock) value is 60Ω·m, landfill resistivity value is 700Ω·m, and surface cover resistivity value is 150Ω·m; the line length is 180m, the pole distance is 3m, and the maximum layer depth is 30m.
1.1Forward analysis
As can be seen from Figure 6, the low-resistance boundaries on both sides can be displayed according to the forward measurement of the actual model measurement, the actual depth of the detection is halved, the anomaly is stretched horizontally as a whole, the high resistance separated in the middle is connected as one, and the horizontal resolution is poor. Affected by it, the surface cover map and the low resistance of the bottom bedrock are not obvious.
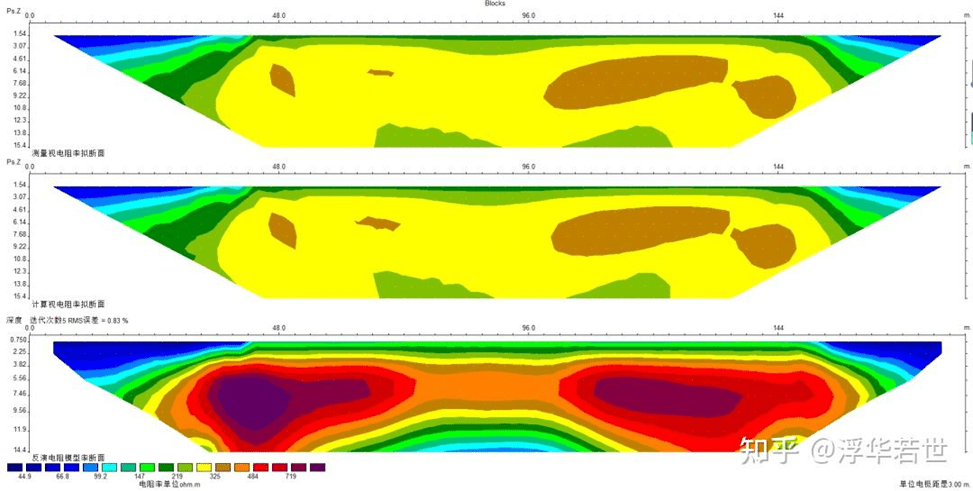
1.2 Inversion analysis
The Res2dinv software was used to perform inversion calculations on the forward modeling results saved in the inversion data format (Figure 7). From the inversion results, it can be seen that the inversion shows that the abnormal results are consistent with the established model, and the details can also be reflected. However, the actual burial depth is quite different. When using this software for inversion processing, it is necessary to add a depth correction coefficient according to the actual conditions.
2. Three-dimensional model
This model has 5 layers (Figure 8). The regional background value is 300Ω·m. A 60Ω·m low-resistance anomaly is set in the first layer 0~5m, a 60Ω·m low-resistance anomaly is set on both sides of the second layer 5~10m, a 700Ω·m high-resistance anomaly is set in the middle area of the third layer 10~15m, no anomaly is set in the fourth layer 15~18m, and a 60Ω·m low-resistance anomaly is set in the fifth layer 18~25m.

In this work, the theoretical model was combined with RES3DMOD software to establish a three-dimensional model for forward and inverse calculations. The measurement parameters were 30×30 grid and 3m pole spacing.

After forward and inversion calculations, the maximum effective depth of the model is 25m. In order to better fit the original state of the model, Res3dinvx64 3D inversion software is used for inversion calculation. From the inversion results, it can be seen that the relative position and shape of the high-resistance area wrapped by the low-resistance area in the horizontal and vertical directions are consistent with the forward model.
This model is only simulated for the high-resistance landfill area under ideal conditions, and there are certain differences with the actual measurement results, but the general trend is consistent. The boundaries between the high-resistance landfill area and the low-resistance surrounding rock can be reflected, indicating that the actual measurement results of the two-dimensional profile are true and reliable. It is recommended to use true three-dimensional full measurement for data collection as much as possible when conditions permit.

Ⅵ.Conclusion
1. Geotech’s WGMD-10X 10-channel centralized high-density electrical measurement system can be used to effectively measure landfills, and the measurement results are stable and reliable.
2. From the measurement results, it can be seen that this measurement accurately depicts the surrounding rock boundary, bottom boundary and spatial morphology of the landfill. According to the measurement results, no leakage occurred in the measurement area.
3. Since the data were collected and measured on the same day of the same work, the apparent resistivity value of each measurement line is relatively fixed. Professional software can be used to perform three-dimensional visualization processing on the two-dimensional data. The data are put together for longitudinal interpolation to establish a spatial position relationship, which can more accurately reflect the abnormal boundary and three-dimensionally and intuitively depict the abnormal morphology.
4. The results of the three-dimensional visualization of the two-dimensional measurement can only reflect the abnormal boundary and volume through the isosurface displayed by the interpolation result, which has a certain deviation from the actual morphology. The reason for the analysis should be that there is no longitudinal data and the quantity is incomplete; on the other hand, the internal components of the landfill are complex and unevenly distributed, resulting in resistivity differences.
5. According to the results of profile measurement and the actual situation, a two-dimensional profile forward model and inversion model are established for analysis. The actual measurement results can be matched, and the electrical method can effectively depict the anomaly. The corresponding software inversion depth is biased. The correction coefficient should be added during the actual measurement process to make the measurement results more scientific and accurate.
6. The three-dimensional forward model and inversion model are consistent with the actual landfill. It is recommended to use the three-dimensional full measurement mode when the measurement conditions are met. The measurement data points are more than the two-dimensional measurement to obtain more information, and the details are more clear and accurate.
FAQ
What is the main difference between a single tap and a double tap?
What is the principle of high-density electrical prospecting?
What are the advantages of high-density electrical method?
In what fields is the high-density electrical method generally used?
What are the application characteristics of high-density electrical method?