Welcome to Geotech!
【WDA-1】Application of electromagnetic method in groundwater exploration
Description
Ⅰ.Introduction
There is a rising concern in Bundelkhand region of Madhya Pradesh for exploiting groundwater resources to meet the water demands of agricultural, domestic and industrial sectors. The enormous size of the farming area remains unirrigated due to limited capacity of underlying aquifers. The aim of study is to investigate the subsurface geological setting of the area to understand the occurrence of groundwater and assess the groundwater potential in the area. Geologically the Proterozoic Bijawar Group overlies Bundelkhand granite and underlies Vindhyan Super Group in the area and comprises dolomites, shale, sandstone, ferruginous chert breccias and conglomerate in order of their formation. The basement in the area is Bundelkhand Granites. Caverns and fractures in limestone are forming the complex paths for groundwater movement in multi aquifer system. (CGWB, 2009).
Traditional resistivity surveys use four equidistant electrodes in a standard configuration. A low frequency current is applied across the outer electrodes and the voltage measured across the inner electrodes. The voltage is converted into a resistivity value representing average ground resistivity between the electrodes. Depth probes provide models of vertical variations in ground resistivity using an expanding electrode array offset from a central reference point. Depth penetration increases with wider electrode separation, providing a one dimensional layered resistivity model (Loke, 1997, 1999, 2000). Composite sections are produced by interpolating between depth probes at regular intervals along a survey line. Unit electrode spacing is determined by parameters that include profile length, desired resolution and targeted depth penetration. A switching unit takes a series of constant separation readings along the length of the electrode array. The separation between sampled electrodes is then widened to increase the effective depth penetration and the procedure is repeated automatically.
There is one of the new developments in recent years in geophysical method is the use of 2-D electrical imaging/tomography surveys to map subsurface horizons with moderately complex geology. Electrical resistivity imaging is being successfully utilized for characterizing the subsurface for many years. The method is labour intensive and the results are based on subjective interpretation (Roman, 1952; Zhou et al., 2002; Wijesinghe, 2004). The computer controlled multi-electrode systems and resistivity modeling software have allowed more cost- effective resistivity surveys with better interpretation of the subsurface (Barker, 1989). These surveys are usually referred to as electrical resistivity imaging (ERI) or electrical resistivity tomography (ERT) (Zhou et al., 2002). As the methods allow fast data collection and quick interpretation it has become a valuable method in subsurface investigations. The methodology is being used for many purposes in different geological formation (Suzuki, 2000; Carderellie et al, 2003; Dobecki et al, 2006; Andrej et al, 2010).
STUDY AREA:
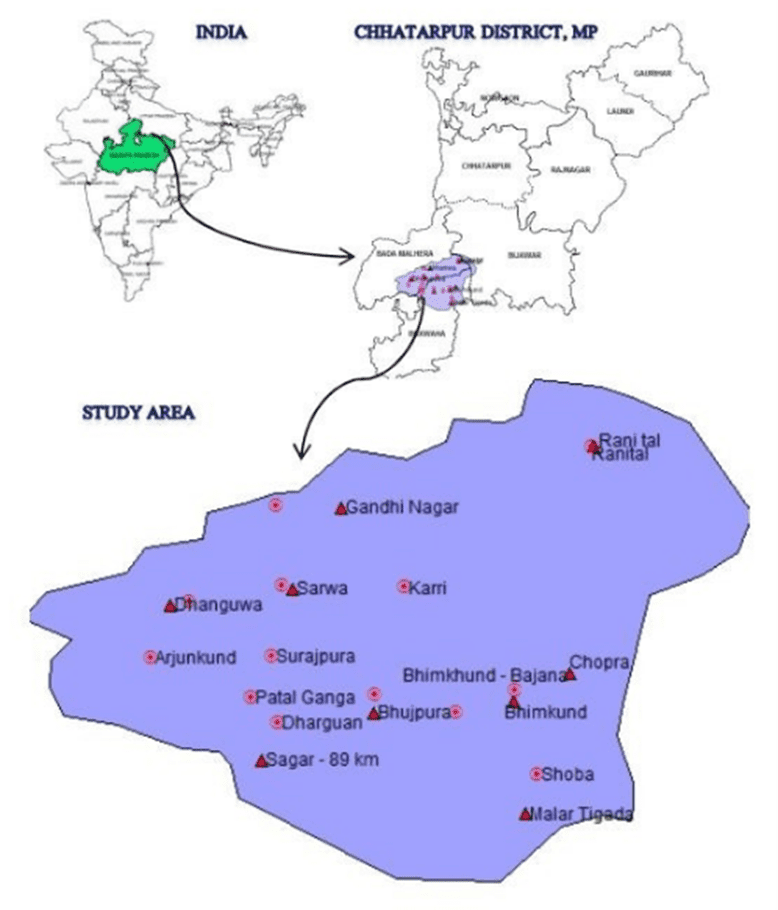
Chhatterpur district is located in the central part of Bundelkhand plateau in Madhya Pradesh. It forms the northern boundary of the state. The investigated area confined to the part of Bada Malhera and Buxwaha blocks of Chhatterpur district, Madhya Pradesh. As per groundwater resource estimation report (CGWB, 2015) both block falls under semi critical category. The location map of study area is shown in figure 1.
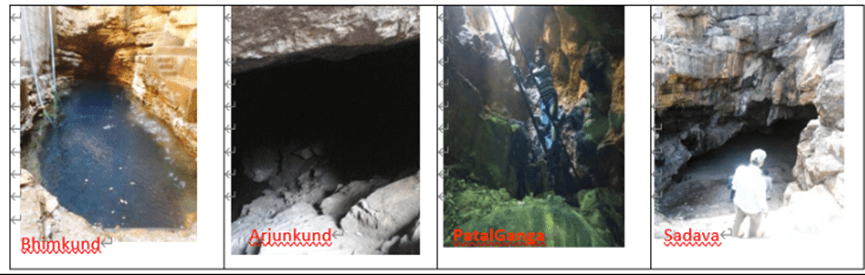
The area is infested with several huge underground cavities/water pools namely Bhimkund, Sadwa Gufa, Arjun Kund, Patal Ganga, etc. These caves are unique in a way that they were further modified in irregular dimension and shape due to collapse of ceiling subsequent to the `solution’ activity of carbonate rock formation. Bhimkund (24.4384760N, 79.3761220E) is a natural water pool (Kund) located near Bajana village. It is reported that the depth of Kund is not measurable beyond 80 m bgl and the water level was at about 30 m bgl (February, 2015). It is reported that, depending on rain, during post monsoon seasons water level raises up to 15 -20 m bgl. The colors of water of kund look like indigo blue. A motor pump is permanently fitted for drinking water and some motor pumps are being temporarily fitted to draw the water for irrigation. Arjunkund (24.45650N, 79.207138890E) is a natural underground water reservoir located near Pipariya Kalan (Near Dhanguawn) village. Flat looking immeasurable reservoir has been created in the cave and water level is at about 20 m bgl from the entry to the cave (February, 2015). Going more than 50 m in cave, it appears that water is spread over very large area and look like an underground lake. It is reported that, depending on rain, during post monsoon water level raises up to 10 -12 m bgl. Some motor pumps are temporarily being fitted to draw the water for irrigation. Patal Ganga (24.4398060N, 79.253830E), a natural enclosed depression of carbonate rock is located near Darguawan village (left of Sagar – Chhatarpur road). The entry to the cave is tough and about 10 m iron’s ladder is fixed for entering. Going about 100 m in cave, it is found that water is spread over very large area and look like an underground lake. During post monsoon water raises to upward. Sadwa Gufa (24.485440N, 79.272720E) is a natural enclosed depression in carbonate rock and is located in a hillock near village Sadwa (left of Sagar – Chhatarpur road). It is dry cavity and there is no water available except during rainy season. Photographs of these cavities are shown in figure 2.
Ⅱ.Geology and hydrogeology
Physiographically the Chhatarpur district has been divided broadly in to three main geomorphic units ie. Panna range, the central plateau and northern plains. Archeans are overlain by Bijawar and Vindhyan beds which are highly folded and are also dissected by the superimposed drainage system. About 65% of the district is occupied by Bundelkhand granite in northern & north central part with a thin soil cover. The granite is pink in color, medium to coarse grained porphyiatic in texture. It is very hard & compact with well developed joints.
The depth of weathering is as high as 20m in areas where the granite is coarse grained and well jointed (CGWB, 2009; Thakur, 2010).
Bundelkhand granites are overlain by the rocks of Bijawar series. The exposure of Bijawars triangular in shape and constitute about 15% of the south eastern part of the district. The Vindhyans are exposed in the form of NE-SW trending strike ridges and alternating valley in the southern part of the district these occupy about 20% of the district areas represented by conglomerates, sandstone, shale and limestone in a sequence. The hydrogeological map of study area has been shown in figure 3.
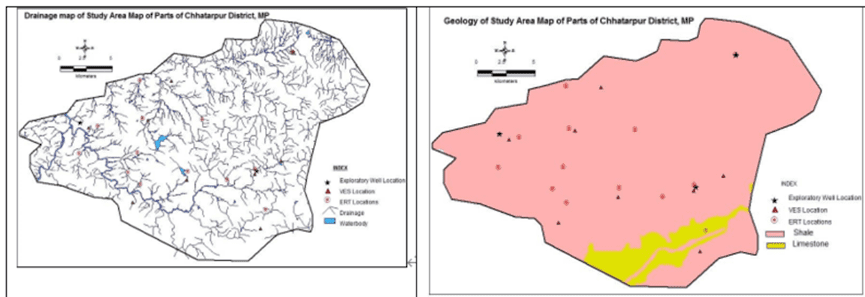
Limestone rocks are a class of sedimentary rocks composed primarily of carbonate minerals. The two major types are limestone, which is composed of calcite or aragonite (different crystal forms of CaCO3 and dolostone, which is composed of the mineral dolomite CaMg(CO3)2. Calcite can either dissolved by groundwater or precipitated by groundwater, depending on several factors including the water temperature, pH, and dissolved ion concentrations. Calcite exhibits an unusual characteristic called retrograde solubility in which it becomes less soluble in water as the temperature increases. When conditions are right for precipitation, calcite forms mineral coatings that cement the existing rock grains together or it can fill fractures. Karst topography and caves develop in carbonate rocks because of their solubility in dilute acidic groundwater. Cooling groundwater or mixing of different ground waters will also create conditions suitable for cave formation.
The principal water-yielding aquifers in the study area can be grouped as unconsolidated weathered aquifer, semi-consolidated fractured aquifers, carbonate-rock aquifers, aquifers in inter-bedded sandstone and carbonate rocks. Aquifers in carbonate rocks are most extensive in the study area. Most of the aquifers formed in cavernous limestone yield good water. The water- yielding properties of carbonate rocks vary widely; some yield almost negligible water and are considered to be confining units, whereas others are the most productive aquifers in the study area. The cavernous limestone forms the shallowest principal aquifer in the study area. Where carbonate rocks are exposed at land surface, solution features have created karst topography, characterized by little surface drainage as well as by sinkholes, blind valleys, sinking streams, and mogotes.
Ground water in investigated area is mostly under water table conditions and its occurrence is controlled by extent, size and interconnection of cavities and degree of weathering which varies from place to place. The depth to groundwater level in study varies from 12 to 20 m bgl during post and pre monsoon period. The groundwater electrical conductivity (EC) ranges from 560 to 680 µS/cm. According to Bhumkund exploratory boreholes data there is shale from 0-3 m, sandstone from 3-25 m, 25 – 32 m shale, 32 – 42 sandstone and 42 – 89 m fractured and compact limestone. The exploratory boreholes in study area yielding 2.5 to 18 lps water discharge.
Ⅲ.Resistivity imaging
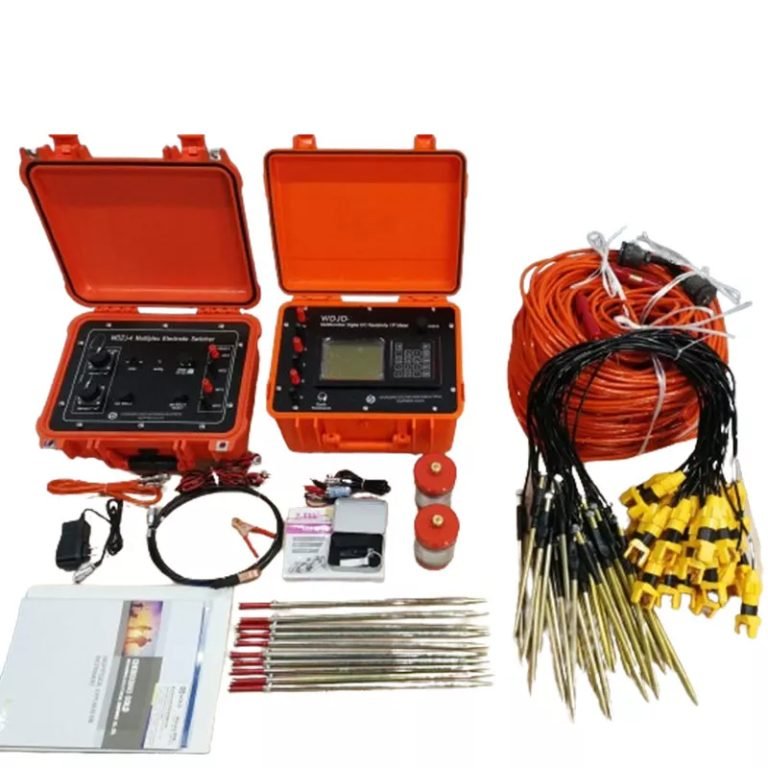
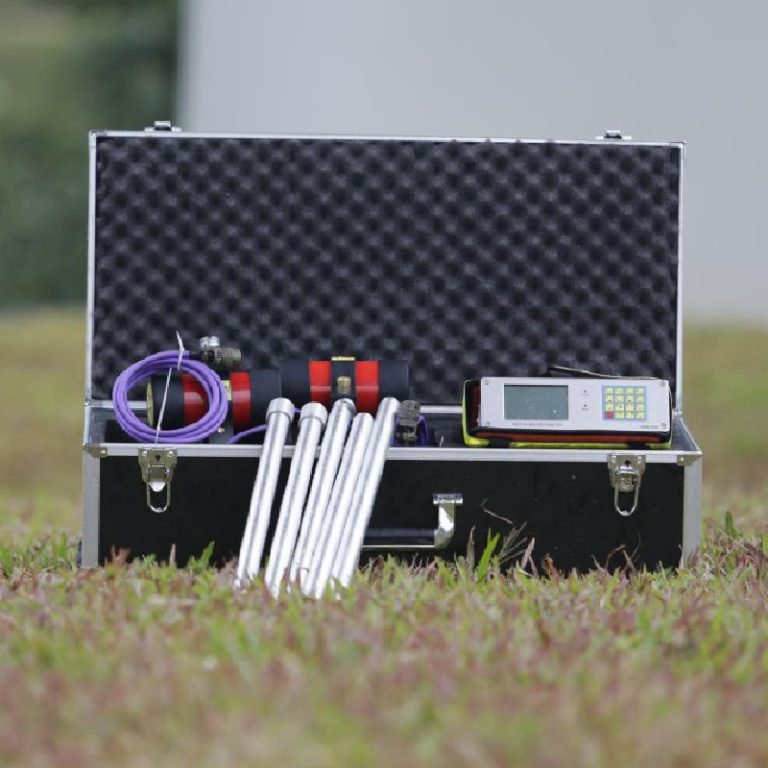
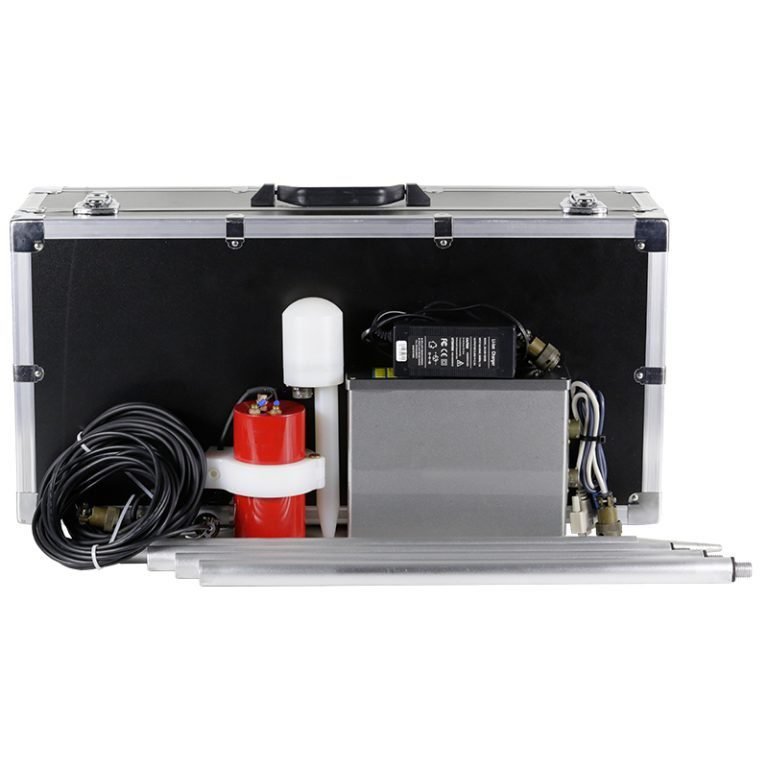
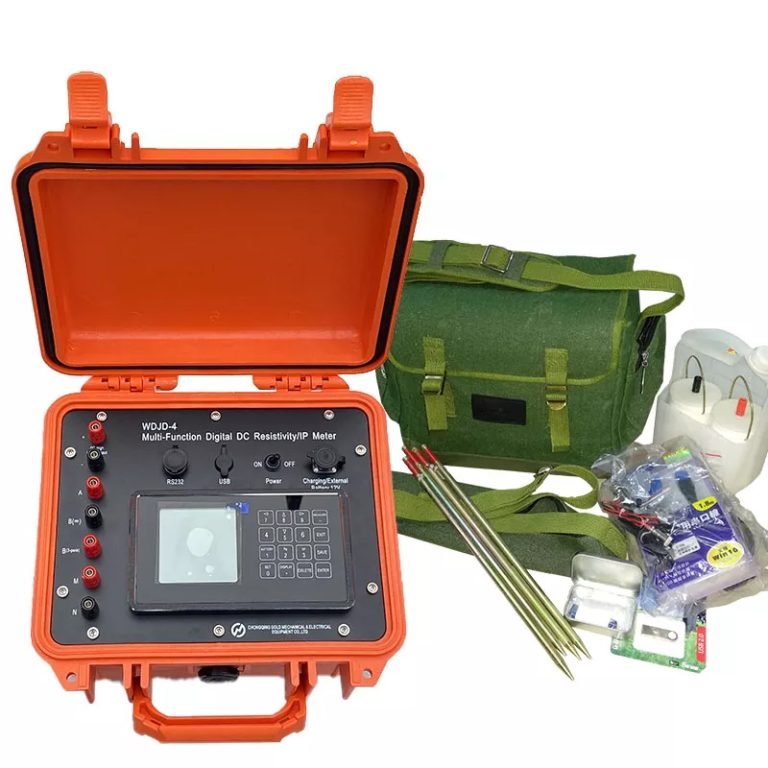
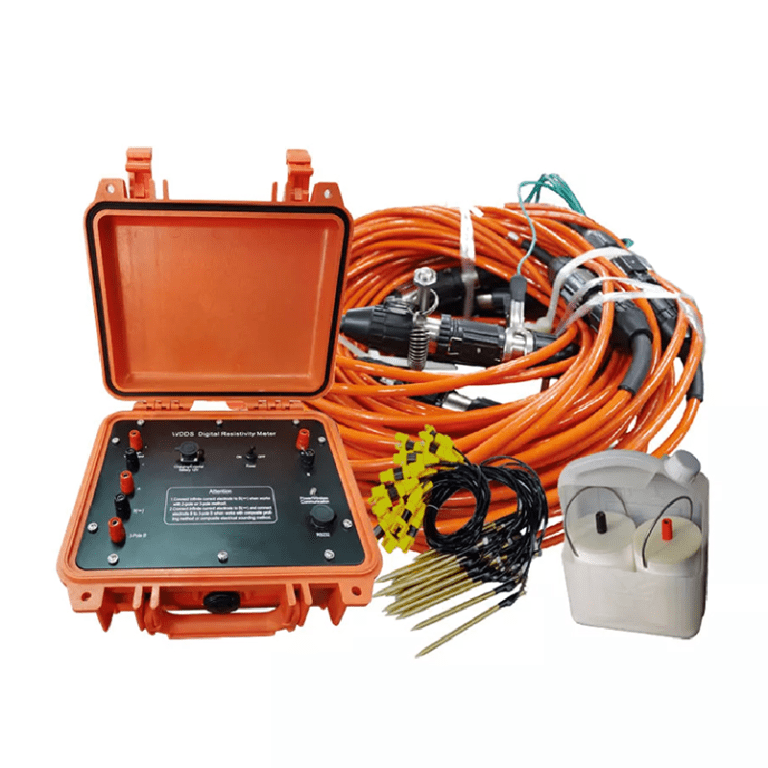
The geophysical survey data of this study comprised of fourteen 2D electrical imaging profiles obtained with Geotech’s WDA-1 DC Electrical ResistivityIP Sounding Meter, using Wenner-α array (Barker, 1989), in an area of around 250 km 2. The each ERT profiles have been observed with 590 m spread length and 10 m electrode spacing using 60 electrodes. In total 741 reading of measured apparent resistivity were recorded with minimum of 10 m unit electrode separation with Wenner array. The data have been processed and analyzed with software Res2dinv. The processed data have demonstrated the lithological changes in terms of resistivity laterally as well as vertically down to the depths of 105 m bgl. At most of profile Wenner, Dipole-Dipole and Schlumberger configurations have been used. Available wells data, geological and hydrogeological information have been used to help in the interpretation of the resistivity tomograms. As the Wenner array provides the deeper depths information, it has been discussed in this study.
Discussion of results
The subsurface resistivity tomograms/sections clearly demonstrated the geoelectrical layer sequence along the profile beneath the ground along the profile line. The different color contours have represented the different lithological unit within a depth range of 105 m bgl. It is observed that the subsurface geological formation along the 2-D image is not uniform and showed vide range of resistivity variations. The electrical imaging profiles surprisingly showed that this area is composed of partly saturated and partly dry/compacted materials that gave rise to a `low’ and `high’ resistivity values in horizontal as well as in vertical direction in most of the ptofiles. It resulted that the electrical resistivity model of the some profiles showed some areas of high resistivity zones in the overburden layer probably due to compactness or due to dry cavity. However in some profiles it indicated some areas of low resistivity zones in the overburden layer probably due to weathered material or due to saturated cavity which may have contributed to low resistivity values in the overburden. The general results show that 2D ERT image and borehole litholog show the same anomalies which indicate that there is a good agreement and correlation between the 2D electrical imaging surveys results and borehole drilling. Various discontinuous resistivity anomalies probably reflect the cavities present in the limestone formations. The linear changes in the resistivity distribution over profiles, which are obvious in most of profiles, probably may relate to the contacts between two different geological formations like weathered and hard limestone, weathered and hard granite, limestone and granites, etc.
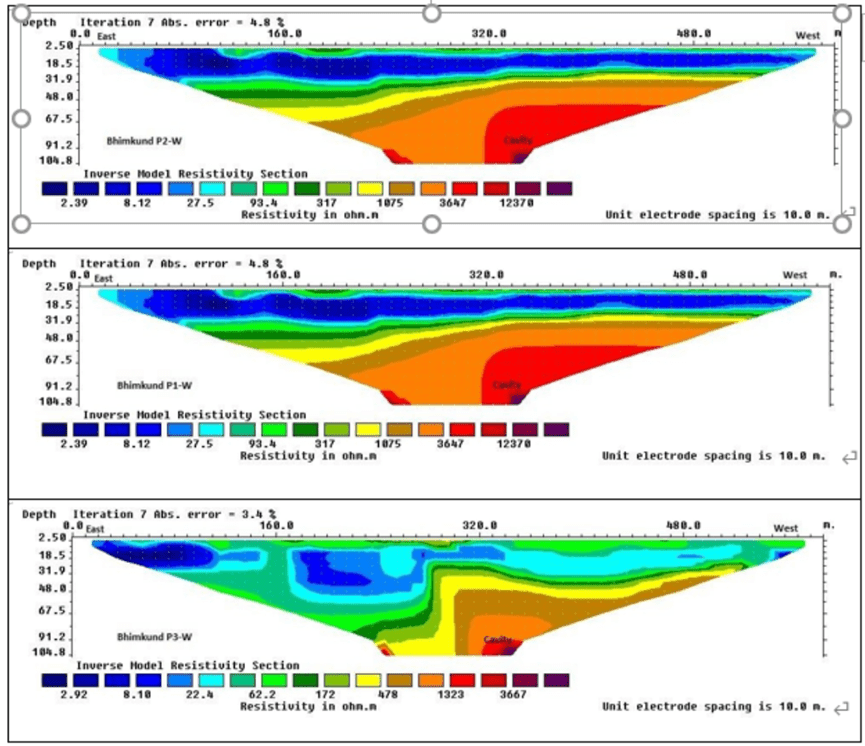
It has been noticed that the air-filled cavities have indicated very high (near-infinite) electrical resistance compared to the wet limestone having resistivity range from 500 to 1000 ohm-m have produced readily recognizable anomalies. The hard and compact limestone and dry limestone cavities have indicated very high overlapping resistivity vales. Based on the geophysical signature of the resistivity cross sections, ‘low’ and `high’ resistivity anomalous areas can be analyzed but due to overlapping of resistivity values its characterization in geological term is difficult due to limitations of resistivity method. In general it is observed that the upper zone resistivity is in the range of 5-250 ohm-m, middle zone resistivity is in the range of 30 – 100 ohm-m where as the bottom layer resistivity is in the range of 4000 to 70000 ohm-m. The subsurface resistivity images of three parallel profiles observed near Bhimkund (24026’31.4” 79022’31”) at Bajna village (Fig. 4) clearly demonstrated the change in subsurface lithological layers. The upper parts of profiles down to the depths of 40 mbgl having the resistivity values of the order of 50 ohm-m have indicated the layered sequence which have been reported as shale and sandstone by exploratory drilling. Below this depth the irregular shape/nature of profiles having quite higher range of resistivity (> 1000 ohm-m), are indicative of limestone formation. The exploratory boreholes drilled over comparative higher range of resistivity anomaly in western part of profile have yielded <18 lps discharge however the observation well falls over lower range resistivity in eastern part of profile yielded >10 lps discharge. During the drilling operation the impact of drilling has been noticed in the Bhimkund (pool). Significantly it is noticed that in central part of profile there is a low resistivity zone which is confined between high resistivity zones may be indicative of cavity.
The Arjunkund (pool) is located beneath a hillock with entrance from foot hills. Out of two parallel resistivity imaging profiles (fig 5), one was observed over the hillock, keeping center of profile just above the Arjunkund. Both the profiles have clearly delineated the presence of major limestone caves down to the depths of 40 m bgl. The extent of cave has been verified visually by entering into the cave.

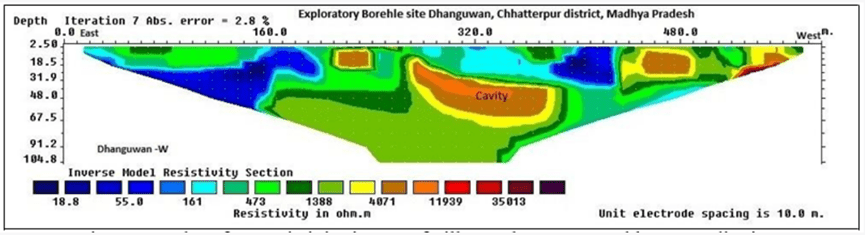
A resistivity imaging profile was observed in the school premises at Village Dhanguwan keeping exploratory borehole as a center of profile. The profile (Fig. 6) indicated the presence of limestone cavity in the center of profile at down to the depth of 25 – 50 mbgl which matches with the exploratory borehole drilling results. Due to presence of cavity the borehole could not be drilled below 42 m. The borehole yielded 15 lps discharge. It is noticed that a borehole already drilled down to the depth of 60 m bgl, which falls over comparatively low resistivity zone of profile, is dry and abandoned.
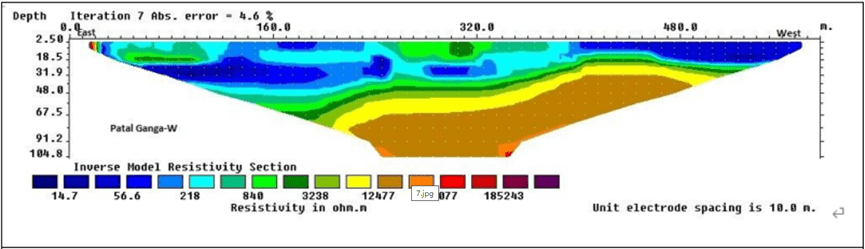
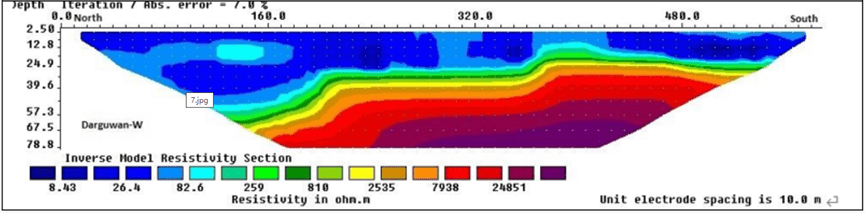
The resistivity imaging profile (Fig 7) of Patal Ganga demonstrates the higher range of resistivity below 20 m depths. It clearly matches with the presence of huge immeasurable limestone cave in the area. Indication of high resistivity zone in central part of profile matches with the high resistivity zone of nearby imaging profile (Fig. 8) observed at village Darguawn.
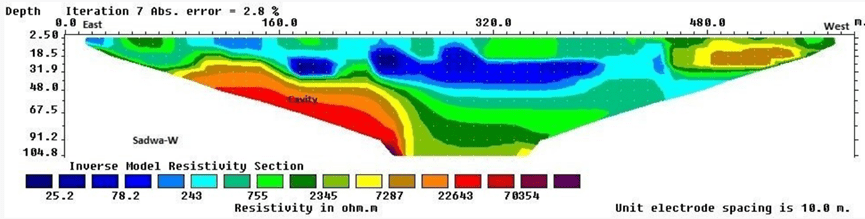
Sadwa cave is also in a hillock. The resistivity imaging profile (fig. 9) has been observed along the foothill. The occurrence of high resistivity in eastern part of profile is indicative of huge cave beneath the hillock.
Ⅳ.Conclusion
Based on prevailing hydrogeological conditions and results of geophysical surveys it is concluded that many underground cavities/water pools/reservoirs namely Sadwa Gufa, Arjun Kund, Patal Ganga, Bhimkund, etc have indicated the strong weathering/karstification in limestone rock in the study area. The overburden comprised of weathered limestone or weathered granites ranges down to the depths of 5 to 30 m bgl. It is found that due to fluctuation in depths to water level in prevailing cavities, it is felt that these cavities may be directly getting recharged through groundwater as well as some of the cavities may be getting recharged directly through surface water bodies or drainage/rivers exist in the area.
The ERI survey of a Bada Malehra and Buxwaha block of Chhatarpur district, Madhya Pradesh revealed several `low’ and `high’ resistivity regions have been interpreted as clay/water- filled voids and dry cavity in a karst terrain. Exploratory boreholes drilled in the area revealed numerous cavities and verified the resistivity measurements with overall accuracy. Also, the resistivity models obtained over the known cavities and the field survey results demonstrated the efficacy of Wenner α array ERI method in subsurface cavity mapping. The drilling result validated cavity location and existence delineated by the geophysical technique and lent credence to its manifestation in karst terrain.
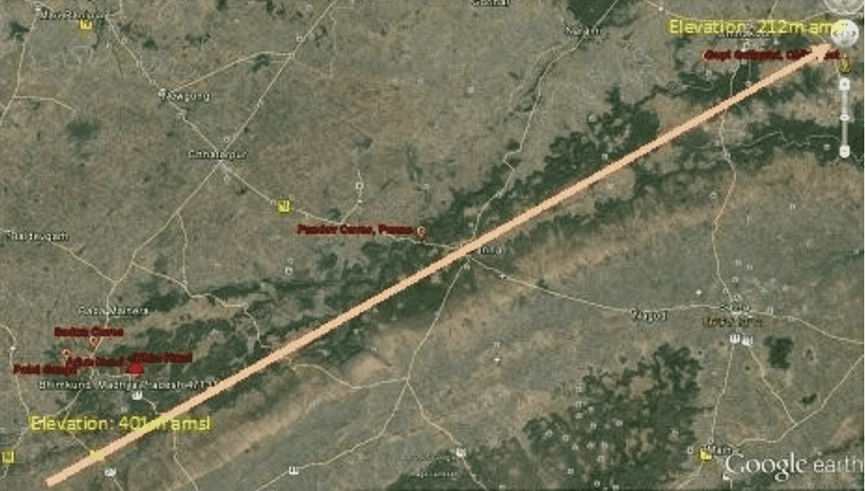
It has been observed that there are some famous limestone cavities like Pandav caves (near Panna) and Gupt Godavari (near Chitrakoot) in nearby region. These famous cavities have been plotted on Google map along with the major cavities present in study area (figure 10). It is found that the cavities present in study area are falling in the same southwest northeast line of Gupt Godavari. The Google map is showing the same geological features/lineaments all along the southwest northeast line. It is also marked that the general elevation of study area is around 401 m amsl while the elevation of Gupt Godavri area is about 212 m amsl. Similar geological features of all these cavities all along the line may be indicative that the Arjun Kund, Patal Ganga and Bhimkund cavities may have some relationship with Gupt Godawari cavity.
Acknowledgements
The author is grateful to Shri Parvinder Singh, Regional Director, Central Ground Water Board, North Central Region, Bhopal for assigning the investigation and providing the necessary facilities. We are thankful to Late Shri M C Gupta, Dr Bijendra Baghel and Dr Satish Patel of GWD, Govt. of MP for their continuous support during field investigations. We fully acknowledge the support of all Scientists of North Central Region and Engineering Division XII. Of CGWB
References
Andrej, M. and Uros, S. (2010). Electrical resistivity imaging of cave Divasˇka jama, Slovenia. Journal of Cave and Karst Studies, v. 74, no. 3, p. 235–242. DOI: 10.4311/2010ES0138R1 Barker, R.D. (1989). Depth of investigation of collinear symmetrical four-electrode arrays. Geophysics, 54, 1031-1037.
Cardarelli, E., Marrone, C. & Orlando.L. (2003).Evaluation of tunnel stability using integrated geophysical methods. Journal of Applied Geophysics. 52, 93-102.
CGWB (2009). Groundwater brochure of Chhatarpur district.
CGWB (2015). Dynamic groundwater resources of Madhya Pradesh as on 2011.
Dobecki, T. L. and Upchurch, S. B. (2006). Geophysical applications to detect sinkholes and ground subsidence. The Leading Edge.
Friedel, S., Thielen, A. & Springman, S.M. (2006). Investigation of a slope endangered by rainfall-induced landslides using 3D resistivity tomography and geotechnical testing. Journal of Applied Geophysics. 60,100-114.
Loke, M. H. (1997, 1999, 2000). Electrical imaging surveys for environmental and engineering studies A practical guide to 2-D and 3-D surveys.
Roman, I. (1952). Resistivity reconnaissance, in Symposium on Surface and Subsurface Reconnaissance, Philadelphia, American Society for Testing Materials, Special Technical Publication 122, p. 171–226.
Suzuki K., Toda S., Kusunoki K., Fujimitsu Y., Mogi T., Jomori A. (2000). Case studies of electrical and electromagnetic methods applied to mapping active faults beneath the thick quaternary.Engineering Geology 56, 2–45.
Thakur, G. S., Ushmani, H.U. and Gupta, S. K. (2010). Bhimkund and Arjunkund dolines, Chhatatrpur district, Madhya Pradesh. Journal of Geological society of India, Vol. 76, Issue 4.
Wijesinghe, W.M.,Loke, M.H., & Nawawi, M.N.M. (2004). A comparison of different arrangements of Wenner array using 2D Electrical Imaging Method. Seminar Geofizik 2004. ESSET, Bangi Selangor.
Zhou, W., Beck, B.F., and Adams, A.L. (2002). Effective electrode array in mapping karst hazards in electrical resistivity tomography: Environmental Geology, v. 42, p. 922–928. doi:10.1007/s00254-002-0594-z.
Further reading | Technical solutions related to this article
In the field of resource exploration and engineering testing, accurate data is the key to success. As an innovator of resource and environmental instruments, Geotech has always taken high-precision electrical exploration technology as its core to provide reliable solutions for global users.
If you want to learn more about how the [Electrical Exploration System (ERT)] can help mineral exploration and geological research, please click on the electrical instrument product page to explore details, or visit Geotech’s official website to view the full range of exploration equipment (covering more than ten categories of products such as magnetometers, seismic nodes, and geological radars). Our technical team is on call at any time to customize scientific solutions for your project – making unknown strata a controllable data map.
FAQ
What is the main difference between a single tap and a double tap?
What is the principle of high-density electrical prospecting?
What are the advantages of high-density electrical method?
In what fields is the high-density electrical method generally used?
What are the application characteristics of high-density electrical method?