Welcome to Geotech!
-1.png)


4D ERT Monitoring: A Complete Technical Guide to Time-Lapse Resistivity Imaging
TIPS:4D ERT monitoring captures dynamic subsurface changes by repeating electrical resistivity tomography surveys over time. Unlike static ERT, which produces a single snapshot, time-lapse resistivity imaging tracks how groundwater, contaminants, or geological structures evolve. This guide explains the physics, field methods, data processing, and real-world applications of 4D ERT monitoring for geophysical engineers and environmental professionals.
Ⅰ. Introduction
Subsurface conditions change. Groundwater levels rise and fall with seasons. Contaminant plumes migrate through aquifers. Landslides accelerate after rainfall. Mine tailings dams develop seepage pathways. Traditional geophysical surveys capture only a single moment in time. They cannot reveal how these processes evolve.
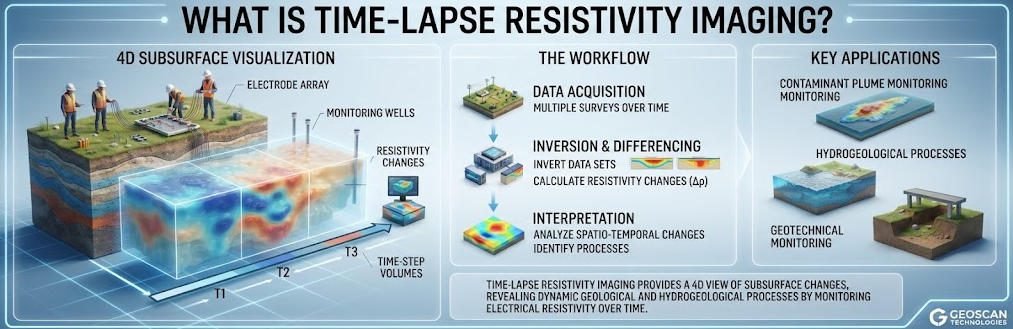
4D ERT monitoring solves this problem. It repeats electrical resistivity tomography surveys at regular intervals. Each survey produces a 3D resistivity model. When these models are compared over time, they reveal dynamic subsurface processes. Engineers call this time-lapse resistivity imaging. The fourth dimension is time.
This technology has matured significantly over the past two decades. Early time-lapse studies relied on manual electrode redeployment. Modern systems use permanent electrode arrays with automated data acquisition. Inversion algorithms have evolved from simple smoothness-constrained methods to sophisticated difference-inversion techniques. Hardware now supports hundreds of electrodes with real-time data transmission.
This guide provides a comprehensive technical overview of 4D ERT monitoring. It covers the physical principles that make time-lapse imaging possible. It explains field configurations, from portable repeat surveys to permanent monitoring installations. It details data processing workflows, including difference inversion and error analysis. It examines real-world applications across environmental, geotechnical, and mining sectors. Finally, it compares 4D ERT with alternative monitoring technologies and outlines best practices for quality assurance.
Whether you are designing a groundwater monitoring network, tracking a remediation project, or assessing slope stability, this guide will help you apply 4D ERT monitoring effectively.
Ⅱ. What Is 4D ERT Monitoring?
1. Definition
4D ERT monitoring is the repeated acquisition and inversion of electrical resistivity tomography data over the same location to detect and quantify temporal changes in subsurface resistivity. The three spatial dimensions come from the ERT survey geometry. The fourth dimension comes from repeated measurements over time.
The method is also called:
- Time-lapse ERT (TLERT)
- Time-lapse resistivity imaging (TRI)
- 4D electrical resistivity tomography
- Electrical resistivity monitoring (ERM)
Each term emphasizes a different aspect. “Time-lapse” highlights the temporal repetition. “4D” emphasizes the spatiotemporal data volume. “Monitoring” stresses the continuous or semi-continuous nature of the measurements.
2. How It Differs from Static ERT
Static ERT produces a single resistivity model. It answers the question: What is the subsurface structure right now? 4D ERT answers a different question: How is the subsurface changing over time?
This distinction has important practical consequences. Static ERT prioritizes spatial resolution and model accuracy at one moment. 4D ERT prioritizes the detection of small resistivity changes against a background model. The signal of interest is the difference between two time steps, not the absolute resistivity value.
| Parameter | Static ERT | 4D ERT Monitoring |
|---|---|---|
| Primary output | Single resistivity model | Time-series of difference models |
| Survey frequency | One-time or occasional | Repeated (hourly to annually) |
| Electrode setup | Temporary, redeployed each survey | Permanent or semi-permanent arrays |
| Inversion focus | Absolute resistivity distribution | Resistivity change detection |
| Spatial resolution | Optimized for each survey | Must remain consistent across surveys |
| Error sensitivity | Moderate (affects single model) | High (affects change detection) |
| Cost structure | Lower per survey, no installation | Higher initial setup, lower per cycle |
| Best use case | Site characterization, reconnaissance | Process monitoring, early warning |
3. The Fourth Dimension: Time
Time in 4D ERT is not continuous. It consists of discrete survey epochs. The interval between epochs depends on the process being monitored:
- Rapid processes (infiltration, tracer tests): Minutes to hours
- Seasonal processes (groundwater fluctuation, freeze-thaw): Weeks to months
- Long-term processes (contaminant migration, landslide creep): Months to years
The choice of interval involves a trade-off. Shorter intervals capture rapid changes but generate large data volumes. Longer intervals reduce data volume but may miss transient events. The optimal interval matches the characteristic time scale of the target process.
Ⅲ. Physical Principles and Measurement Basis
1. Electrical Resistivity Fundamentals
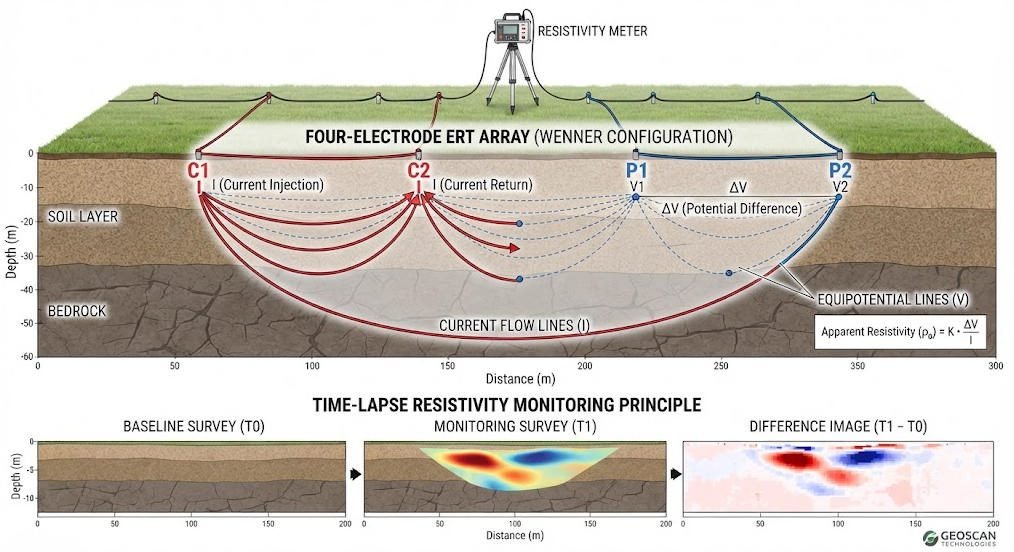
4D ERT monitoring relies on the same physical principles as static ERT. A resistivity meter injects direct current into the ground through two current electrodes. It measures the resulting voltage difference between two potential electrodes. Ohm’s Law relates these quantities:
ρa = k × (ΔV / I)
Where ρa is apparent resistivity, k is the geometric factor (dependent on electrode spacing and array type), ΔV is the measured voltage, and I is the injected current.
The apparent resistivity is not the true resistivity of any specific layer. It is the resistivity that a homogeneous half-space would need to produce the same measurement. Inversion algorithms convert apparent resistivity data into true resistivity models.
2. What Causes Resistivity to Change Over Time?
4D ERT monitoring detects changes because subsurface resistivity is sensitive to multiple dynamic factors:
- Water content: Resistivity decreases as saturation increases. This is the dominant signal in most monitoring applications.
- Pore fluid chemistry: Saline intrusion decreases resistivity. Freshwater recharge increases it.
- Temperature: Resistivity decreases approximately 2% per degree Celsius increase in groundwater.
- Clay content and mineralogy: Weathering or swelling clays alter resistivity.
- Contaminant presence: Hydrocarbons typically increase resistivity by displacing conductive water. Dissolved metals decrease resistivity.
The sensitivity to these factors makes ERT ideal for monitoring hydrological and environmental processes. However, it also creates ambiguity. A resistivity decrease could indicate rising water table, saline intrusion, or warming. Data interpretation requires auxiliary information from boreholes, meteorological stations, or other geophysical methods.
3. Array Configurations for Monitoring
The choice of electrode array affects depth of investigation, resolution, and signal strength. Common arrays for 4D ERT monitoring include:
| Array Type | Depth Penetration | Horizontal Resolution | Vertical Resolution | Noise Sensitivity | Best Monitoring Application |
|---|---|---|---|---|---|
| Wenner | Moderate | Moderate | Good | Low | Layered aquifer monitoring |
| Schlumberger | Deep | Moderate | Very Good | Low | Deep groundwater changes |
| Dipole-Dipole | Shallow | Excellent | Moderate | High | Shallow contaminant plumes |
| Pole-Dipole | Deep | Good | Moderate | Moderate | Large-area landslide monitoring |
| Gradient | Moderate | Excellent | Moderate | Low | 3D monitoring with optimized arrays |
For time-lapse monitoring, array consistency is critical. Changing the array between epochs introduces artifacts that can be mistaken for real subsurface changes. Most monitoring projects select one array type and maintain it throughout the survey period.
Recent research has shown that optimized arrays can improve information gain for specific monitoring targets. The multiple-gradient array often outperforms standard dipole-dipole configurations in 4D temperature field monitoring experiments.
Ⅳ. From Static to Dynamic: How 4D ERT Works
1. The Monitoring Workflow
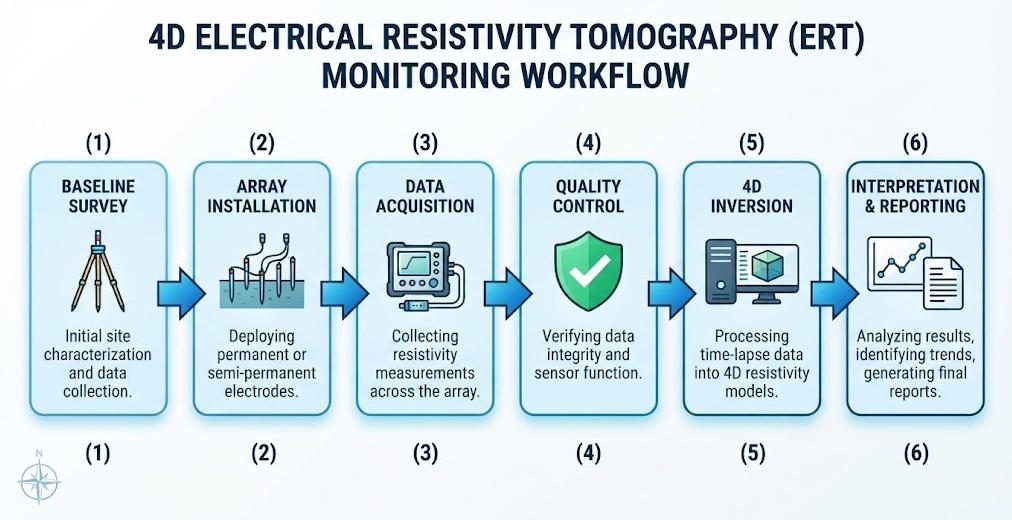
A complete 4D ERT monitoring project follows a structured workflow:
Step 1: Baseline Survey Conduct a high-quality static ERT survey to establish the background resistivity model. This baseline must have excellent spatial coverage and low noise. It serves as the reference for all subsequent change detection.
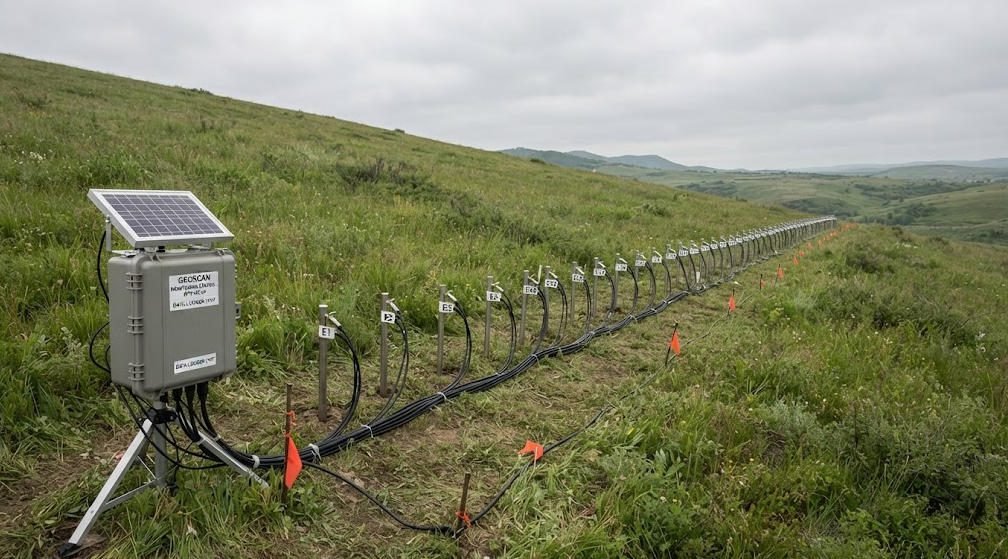
Step 2: Permanent Array Installation Install electrodes at fixed positions. For surface monitoring, electrodes are typically stainless steel stakes driven 20–50 cm into the ground. For borehole monitoring, electrodes are attached to PVC casings and lowered into wells. Cable connections must be waterproof and protected from environmental damage.
Step 3: Repeated Data Acquisition Program the resistivity meter to acquire data at scheduled intervals. Automated systems can trigger surveys based on time, external sensors (rain gauges, piezometers), or manual commands. Each epoch should use identical acquisition parameters: current level, measurement sequence, and stacking settings.
Step 4: Data Quality Control Check each dataset for noise, outliers, and electrode contact resistance changes. Compare apparent resistivity values between epochs. Flag measurements that deviate beyond expected statistical limits.
Step 5: Time-Lapse Inversion Process the data using difference inversion or independent inversion with model subtraction. Difference inversion directly solves for resistivity changes, reducing inversion artifacts. Independent inversion followed by subtraction is more robust but amplifies noise.
Step 6: Change Interpretation Analyze the time-series of difference models. Correlate resistivity changes with independent data (rainfall, pumping records, remediation injections). Quantify change magnitude and spatial extent.
Step 7: Reporting and Decision Support Generate maps, cross-sections, and time-series plots. Provide actionable information to project managers, regulators, or operations teams.
2. Survey Modes: Portable vs. Permanent Arrays
4D ERT monitoring can use two fundamentally different approaches:
Portable Repeat Surveys The electrode array is deployed, data are collected, and the equipment is removed. The same array is redeployed at later dates. This approach is cost-effective for short-term projects or infrequent monitoring. However, it introduces positional errors. Even small electrode misplacements (a few centimeters) can create apparent resistivity changes that mimic real subsurface signals.
Permanent Arrays Electrodes remain in place for the entire monitoring period. A resistivity meter or switching unit connects to the array automatically. This approach eliminates positional errors and enables high temporal resolution. It is essential for automated monitoring systems. The British Geological Survey has developed automated time-lapse ERT (ALERT) systems for continuous monitoring of geotechnical assets.
Permanent arrays require careful installation. Electrodes must resist corrosion over years of exposure. Cables must withstand temperature cycles, UV radiation, and biological damage. Connection points are the most common failure mode.
3. Temporal Resolution Considerations
The achievable temporal resolution depends on the acquisition system and the number of electrodes:
| Electrode Count | Measurements per Epoch | Acquisition Time (Typical) | Maximum Daily Surveys |
|---|---|---|---|
| 24 | ~200 | 10–15 minutes | ~50 |
| 48 | ~1,000 | 30–60 minutes | ~20 |
| 64 | ~2,000 | 1–2 hours | ~10 |
| 120 | ~5,000 | 3–5 hours | ~4 |
These values assume a modern multi-channel system with 10–60 parallel measurement channels. Single-channel systems take proportionally longer. For processes requiring minute-level resolution, sparse electrode arrays or optimized measurement subsets are necessary.
Ⅴ. Field Configuration and Equipment Selection
1. Electrode Selection and Installation
Electrode choice affects data quality and system longevity:
Stainless Steel Electrodes Standard choice for most applications. Cost-effective and durable. Suitable for DC resistivity measurements in typical soil conditions. Prone to polarization effects in IP surveys.
Non-Polarizable Electrodes (Ag/AgCl) Essential for induced polarization (IP) monitoring. Minimize electrode polarization artifacts. More expensive and require maintenance (electrolyte replenishment).
Specialized Electrodes For challenging environments, larger electrodes improve contact resistance. Plate electrodes, mesh electrodes, or conductive textile electrodes work well in frozen, rocky, or dry terrain.
Electrode spacing determines both investigation depth and lateral resolution. A common rule is: maximum depth ≈ one-third to one-half of total array length. For monitoring applications, spacing is often dictated by the target size rather than depth. Detecting a 2-meter contaminant plume requires electrode spacing of 1 meter or less.
2. Cable and Connection Systems
Multi-core cables connect electrodes to the resistivity meter. For permanent installations, cables must withstand:
- Temperature extremes (-40°C to +60°C typical)
- UV radiation
- Moisture and chemical exposure
- Rodent and insect damage
Buried cable installations should use protective conduit. Connection points should be sealed with waterproof enclosures. Cable capacitance can affect measurement quality at high frequencies, though this is rarely a concern for standard DC resistivity monitoring.
3. Equipment Selection Framework
Selecting the right 4D ERT monitoring system requires balancing multiple factors:
| Project Factor | Recommendation |
|---|---|
| Monitoring duration | <3 months: portable system; >3 months: permanent array |
| Temporal resolution needed | <1 hour: automated system with remote telemetry |
| Target depth | <30 m: standard surface array; >30 m: borehole ERT or large spacing |
| Budget constraint | Limited: manual portable surveys; Moderate: semi-automated; High: fully automated with telemetry |
| Environmental conditions | Corrosive soil: stainless steel or graphite electrodes; Frozen ground: long electrodes or plate types |
| Data urgency | Real-time decisions: automated with cloud processing; Post-processing acceptable: manual download |
4. Geotech Solutions for 4D Monitoring
Geotech Instrument Co., Ltd. provides multi-channel resistivity and IP systems suitable for time-lapse monitoring. The GIM Series supports 10-channel synchronous acquisition with rolling measurement modes. Systems are compatible with standard inversion software including Res2DInv and EarthImager. The IP67 waterproof rating and -20°C to +60°C operating range accommodate challenging field conditions.
For long-term monitoring projects, Geotech offers electrode array systems with durable stainless steel electrodes and multi-core cables. The WDAS series data acquisition units feature 24-bit A/D conversion for high dynamic range measurements. These systems integrate with both portable and permanent array configurations.
Ⅵ. Data Processing and 4D Inversion
1. Data Preprocessing
Raw ERT data require preprocessing before inversion:
Outlier Removal Identify and remove noisy measurements. Common causes include poor electrode contact, nearby electrical interference, or instrument glitches. Statistical methods (e.g., median absolute deviation) or reciprocal error analysis help identify outliers.
Reciprocal Error Analysis Measure the voltage for both current injection polarities. In a noise-free system, these reciprocal measurements should agree. Large discrepancies indicate poor data quality. Most practitioners reject data with reciprocal errors exceeding 5%.
Contact Resistance Monitoring Track electrode contact resistance across epochs. Increasing contact resistance (due to drying, corrosion, or soil disturbance) degrades data quality. Contact resistance above 10 kΩ often indicates a problem requiring electrode maintenance.
2. Inversion Strategies
Three main approaches exist for 4D ERT data inversion:
Independent Inversion Invert each epoch separately using standard smoothness-constrained algorithms. Subtract the baseline model from subsequent models to obtain change maps. This approach is robust and uses well-tested software. However, it amplifies inversion artifacts. Two independent smooth models may differ even without real subsurface changes.
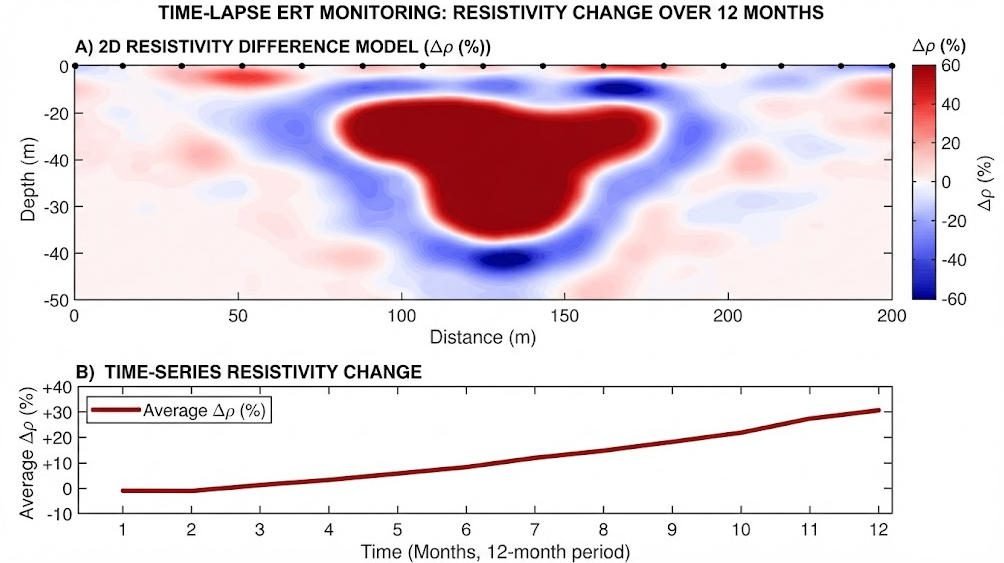
Difference Inversion Invert the data differences directly. The algorithm solves for resistivity changes relative to a fixed background model. This approach suppresses inversion artifacts and enhances change detection sensitivity. It requires that the baseline model accurately represents the true background resistivity.
Constrained Inversion Use the baseline model as a strong prior constraint. Subsequent inversions are heavily regularized toward the baseline. Small changes are resolved with high confidence. Large changes may be underestimated due to the strong constraint.
The choice depends on the expected change magnitude. For small changes (<10% resistivity variation), difference inversion is preferred. For large changes (remediation injections, major infiltration events), independent or weakly constrained inversion works better.
3. Error Analysis and Uncertainty Quantification
4D ERT monitoring must distinguish real changes from noise and inversion artifacts. Key error sources include:
| Error Source | Impact on 4D Data | Mitigation Strategy |
|---|---|---|
| Electrode position errors | Apparent changes from misplacement | Permanent arrays; GPS documentation for portable surveys |
| Contact resistance variation | Time-varying noise | Regular maintenance; non-polarizable electrodes |
| Temperature effects | Seasonal resistivity drift | Temperature correction using borehole data |
| Rainfall and soil moisture | Near-surface resistivity changes | Shallow electrode exclusion; hydrological modeling |
| Telluric currents | Low-frequency noise | Stacking; nighttime acquisition; filtering |
| Inversion ambiguity | Non-unique solutions | Regularization selection; borehole constraints |
Quantifying uncertainty is essential for decision-making. Bootstrap resampling, Bayesian inversion, or stochastic methods can estimate model confidence intervals. However, these methods are computationally intensive and rarely used in routine monitoring.
4. Software Tools
| Software | Capabilities | Best For |
|---|---|---|
| Res2DInv / RES3DINV | 2D/3D smoothness-constrained inversion; time-lapse module | Standard commercial monitoring projects |
| EarthImager | 2D/3D inversion; robust inversion; batch processing | Environmental and geotechnical applications |
| pyGIMLi | Open-source; flexible regularization; research-oriented | Custom algorithms; academic research |
| E4D (PNNL) | Real-time 4D inversion; automated processing | Automated monitoring with rapid turnaround |
| COMSOL | Finite element forward modeling; coupled physics | Research and complex geology |
Ⅶ. Engineering Applications and Case Studies
1. Groundwater and Hydrogeology
4D ERT monitoring tracks groundwater dynamics with high spatial resolution. Applications include:
Aquifer Recharge Monitoring Time-lapse ERT maps infiltration fronts during managed aquifer recharge. Low-resistivity zones indicate saturated soil. The method quantifies recharge rates and identifies preferential flow paths.
Saltwater Intrusion In coastal aquifers, 4D ERT detects the landward migration of saline water. Saltwater has much lower resistivity than freshwater. Monitoring networks with permanent arrays provide early warning of intrusion.
Pump Test Monitoring During aquifer pumping tests, ERT tracks the drawdown cone development. This validates hydraulic models and identifies aquifer heterogeneity that well data alone cannot resolve.
The British Geological Survey has used automated time-lapse ERT to monitor groundwater drawdown and rebound associated with quarry dewatering. The system captured spatial patterns of hydraulic head changes that traditional piezometers missed.
2. Environmental Contamination
LNAPL and DNAPL Tracking Light non-aqueous phase liquids (gasoline, diesel) increase resistivity by displacing water. Dense non-aqueous phase liquids (chlorinated solvents) may decrease resistivity if dissolved or increase it if pure. 4D ERT monitors plume migration and remediation progress.
Remediation Performance During in-situ chemical oxidation or bioremediation, ERT tracks amendment distribution. The ESTCP demonstrated that automated geophysical monitoring provides timely, volumetric information on amendment behavior during enhanced bioremediation.
Landfill Monitoring ERT monitors leachate recirculation in bioreactor landfills and moisture variation in evapotranspiration covers. Studies show that moisture reaches equilibrium approximately 14 days after leachate recirculation, as captured by ERT.
3. Geotechnical and Infrastructure
Landslide Monitoring Groundwater is a primary trigger for slope failures. 4D ERT monitors water table fluctuations, perched water zones, and preferential flow paths in landslide bodies. The method is particularly valuable because it images the entire slope volume, not just discrete sensor points.
Dam and Embankment Safety Permanent ERT arrays monitor seepage through earth dams and levees. Low-resistivity zones may indicate saturated zones or internal erosion pathways. The BGS has researched geoelectrical monitoring for assessing the integrity of water-retaining structures.
Railway and Road Infrastructure Time-lapse ERT monitors soil moisture dynamics beneath railway embankments. Vegetation and subsurface moisture influence cutting stability. Two-year monitoring campaigns have demonstrated ERT’s ability to track seasonal moisture variations and their impact on slope condition.
4. Mining and Energy
Heap Leach Monitoring In mining operations, ERT monitors solution distribution in heap leach pads. It identifies zones of poor percolation or solution channeling. Time-lapse imaging optimizes irrigation patterns and metal recovery.
Geothermal Systems Enhanced geothermal systems (EGS) create fracture networks through hydraulic stimulation. 4D ERT tracks fracture growth by imaging resistivity changes caused by injected fluids. Microseismic data complement ERT by locating fracture events.
CO₂ Sequestration Electrical methods monitor CO₂ plume migration in geological storage sites. CO₂ displaces conductive brine, increasing resistivity. Cross-well ERT provides high-resolution tracking of plume boundaries.
Ⅷ. Advantages and Limitations
1. Key Advantages
Volumetric Coverage ERT provides continuous spatial coverage. Unlike discrete sensors (piezometers, tensiometers), it images the entire subsurface volume. This is critical for heterogeneous environments where point measurements are not representative.
Non-Invasive No drilling is required for surface arrays. This preserves site integrity and reduces contamination risk. For environmental applications, this is often a regulatory requirement.
Sensitivity to Water Content Resistivity is primarily controlled by water content and chemistry. This makes ERT naturally suited for hydrological and environmental monitoring.
Cost Efficiency for Long-Term Monitoring After initial installation, permanent arrays collect data at low marginal cost. Automated systems reduce labor requirements. Over multi-year projects, ERT often costs less than dense sensor networks.
Multi-Parameter Potential IP-capable systems measure chargeability in addition to resistivity. This distinguishes clay minerals from metallic contaminants and provides additional lithological information.
2. Important Limitations
Resolution Decreases with Depth Surface ERT resolution degrades rapidly below approximately one-third of the array length. Deep targets require large electrode spacings, which reduce shallow resolution. Borehole ERT mitigates this but increases cost and complexity.
Ambiguity in Interpretation Resistivity changes have multiple possible causes. A resistivity decrease could indicate rising water table, warming, saline intrusion, or clay swelling. Interpretation requires auxiliary data.
Noise Sensitivity Metallic structures, power lines, and buried cables create noise. Highly resistive ground (dry sand, frozen soil, bedrock) limits current penetration. These factors constrain where ERT monitoring is feasible.
Temporal Aliasing If the survey interval exceeds the Nyquist frequency of the target process, transient events are missed. Rapid infiltration events may occur between surveys.
Inversion Artifacts Smoothness-constrained inversion blurs sharp boundaries. Independent inversions of consecutive epochs may show apparent changes even when the subsurface is static. Difference inversion reduces but does not eliminate this problem.
Ⅸ. Comparison with Other Monitoring Methods
| Method | Measurement | Spatial Coverage | Temporal Resolution | Best Application | Limitation |
|---|---|---|---|---|---|
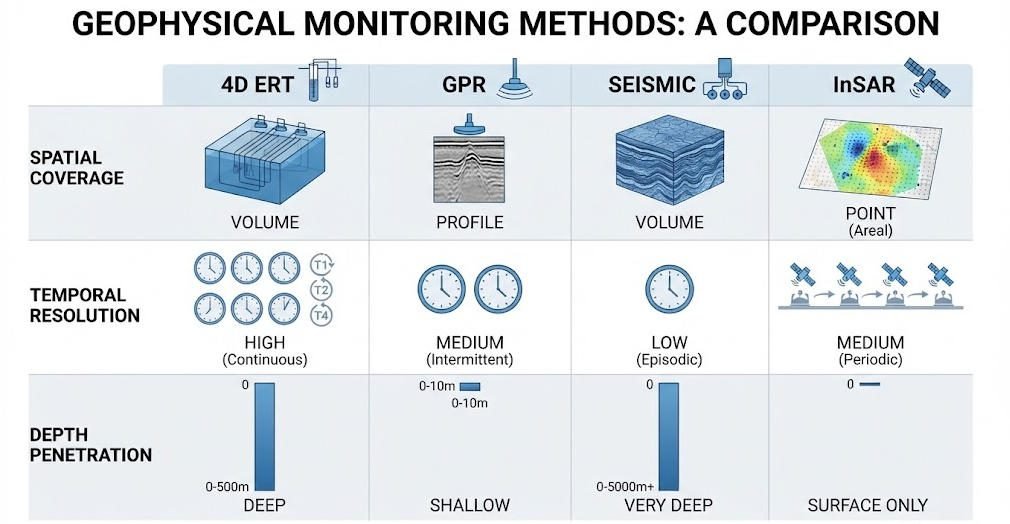
| 4D ERT | Resistivity | 2D/3D volumetric | Minutes to months | Water content, contamination | Depth resolution trade-off |
| GPR | Dielectric permittivity | 2D profiles | Seconds (real-time) | Shallow pipes, voids | Signal attenuation in conductive soils |
| Seismic (MASW) | Shear wave velocity | 2D profiles | One-time or repeat | Soil stiffness, bedrock depth | Insensitive to water content |
| InSAR | Surface displacement | Regional (km²) | Days to weeks | Landslide movement, subsidence | No subsurface information |
| TDR Probes | Dielectric constant | Point measurements | Continuous | Soil moisture at specific depths | No spatial coverage |
| Piezometers | Hydraulic head | Point measurements | Continuous | Water pressure, aquifer levels | No direct imaging |
| Self-Potential (SP) | Natural potential | 2D/3D | Minutes to hours | Groundwater flow, leak detection | Non-unique interpretation |
For comprehensive monitoring, engineers often combine methods. ERT provides the volumetric water content distribution. Seismic methods assess mechanical stability. InSAR tracks surface deformation. Piezometers validate hydraulic interpretations. This multi-method approach reduces ambiguity and increases confidence.
Ⅹ. Best Practices and Quality Control
1. Planning Phase
Define the Monitoring Objective Clearly state what process you are tracking and what decisions the data will support. This determines array geometry, temporal resolution, and inversion strategy.
Characterize the Site Conduct a baseline static ERT survey. Identify noise sources (power lines, pipelines, fences). Measure background resistivity ranges. Collect borehole logs for ground-truth constraints.
Select Appropriate Electrode Spacing Match spacing to target size. A target must span at least 2–3 electrode spacings to be resolved. For monitoring a 5-meter-thick aquifer, use 2-meter spacing.
2. Installation Phase
Document Electrode Positions Use GPS or total station surveys to record electrode coordinates. For permanent arrays, photograph each electrode location. This documentation is essential for troubleshooting.
Minimize Contact Resistance Wet electrodes before first measurement. In dry conditions, use saltwater or bentonite slurry around electrodes. For permanent arrays, bury electrodes below the depth of seasonal moisture variation if possible.
Protect Equipment Use waterproof enclosures for cable connections. Protect cables from UV, rodents, and mechanical damage. Label all cables clearly for maintenance access.
3. Acquisition Phase
Maintain Consistent Parameters Use identical current levels, stacking counts, and measurement sequences for every epoch. Parameter changes introduce apparent resistivity variations.
Monitor Reciprocal Errors Calculate reciprocal errors in the field. Reject epochs with excessive noise before they contaminate the time series.
Record Environmental Conditions Log rainfall, temperature, and any site activities (pumping, construction, remediation) during each survey. These data are essential for change interpretation.
4. Processing Phase
Use Difference Inversion for Small Changes When monitoring subtle processes (seasonal moisture variation, slow contaminant migration), difference inversion directly solves for changes. This improves detection sensitivity.
Validate with Independent Data Compare ERT changes with piezometer readings, well logs, or geochemical sampling. Correlation with independent data builds confidence in the interpretation.
Quantify Uncertainty Report not just the resistivity change but also its uncertainty. Inversion artifacts can create false positives. Decision-makers need to know the confidence level.
Ⅺ. Conclusion
4D ERT monitoring has evolved from an academic curiosity to a practical tool for dynamic subsurface characterization. By repeating electrical resistivity surveys over time, engineers can track groundwater movement, contaminant migration, slope hydrology, and infrastructure integrity with unprecedented spatial coverage.
Success requires more than good equipment. It demands careful array design, rigorous data quality control, appropriate inversion strategies, and integration with independent geological and hydrological data. The method has limitations—depth resolution trade-offs, interpretation ambiguity, and noise sensitivity—but these are manageable with proper planning.
For organizations considering 4D ERT monitoring, the key decision factors are:
- Monitoring duration: Permanent arrays for long-term projects; portable surveys for short-term studies
- Temporal resolution: Automated systems for rapid processes; manual acquisition for seasonal monitoring
- Budget: Balance equipment cost against the value of the information gained
Geotech Instrument Co., Ltd. provides multi-channel resistivity and IP systems designed for both portable and permanent monitoring configurations. The GIM Series offers the acquisition speed, precision, and durability required for professional 4D ERT monitoring projects. For project-specific recommendations, contact our geophysical engineering team.
Reference Sources
| Organization | Resource Name | URL |
|---|---|---|
| Pacific Northwest National Laboratory (PNNL) | From Technology Void to Next-Gen Solution: PNNL Reinvents ERT Monitoring | https://www.pnnl.gov/publications/technology-void-next-gen-solution-pnnl-reinvents-ert-monitoring |
| Frontiers in Earth Science | Windowed 4D Inversion for Near Real-Time Geoelectrical Monitoring Applications | https://www.frontiersin.org/journals/earth-science/articles/10.3389/feart.2022.983603/full |
| U.S. Geological Survey (USGS) | Electrical Resistivity Tomography (ERT) Data Release | https://catalog.data.gov/dataset/electrical-resistivity-tomography-ert-data |
| Society of Exploration Geophysicists (SEG) | SEG Technical Standards for Geophysical Data | https://seg.org/publications/seg-technical-standards/ |
| AGU Publications | Electrical Resistivity Changes During Heating Experiments in Salt Formations | https://agupubs.onlinelibrary.wiley.com/doi/full/10.1029/2024GL109836 |
Internal Knowledge Graph
| Page Title | Core Topic | URL |
|---|---|---|
| What is Wenner Array? Comprehensive Guide to High-Density ERT | ERT array types, Wenner vs Schlumberger vs Dipole-Dipole comparison | https://geotechcn.net/service/ert-wenner-array/ |
| Electrical Resistivity & IP Survey: Complete B2B Guide 2026 | ERT vs IP method comparison, combined survey applications | https://geotechcn.net/service/ert-ip-geophysical-survey-guide/ |
| DJF Series High-Power Digital DC Induced Polarization System | High-power IP measurement equipment, complementary ERT technology | https://geotechcn.net/service/djf-ip-measurement-system/ |
FAQ
Q1: What is the difference between 3D ERT and 4D time-lapse ERT?
3D ERT provides a single static 3D resistivity model of the subsurface at one point in time, while 4D time-lapse ERT adds a temporal dimension by collecting repeated 3D surveys over time. 4D ERT tracks dynamic changes like contaminant migration or fluid movement rather than just static structure. It is used for long-term monitoring projects where process evolution matters more than one-time site characterization.
Q2: How deep can 4D ERT monitoring effectively reach?
Effective monitoring depth depends on electrode spacing, array type, and transmitted power, with a general rule of thumb that depth equals roughly 1/5 of the total array spread. Surface-only arrays typically reach 100–300 meters, while surface-borehole hybrid arrays can extend to 3000 meters for deep reservoir monitoring. Deeper targets require lower frequency signals and wider electrode configurations.
Q3: How accurate is time-lapse ERT for detecting subsurface changes?
High-density 4D ERT systems can detect resistivity changes as small as 0.01 Ω·m and locate anomalies with ±0.15m spatial accuracy under favorable conditions. Accuracy depends on electrode density, noise levels, and inversion algorithm quality. This level of precision enables detection of small contaminant plumes, minor fracture propagation, and subtle fluid saturation shifts.
Q4: What are the main advantages of 4D ERT over other geophysical monitoring methods?
4D ERT offers non-invasive, continuous monitoring with high temporal and spatial resolution at a lower operational cost than borehole-only methods. Unlike GPR, it penetrates beyond shallow depths and works in conductive soils. Unlike seismic monitoring, it requires no active vibration sources and operates silently. It is particularly cost-effective for long-term autonomous monitoring programs.
Q5: What factors should be considered when selecting an ERT monitoring system?
Key selection factors include required channel count for target coverage area, temporal resolution matching monitoring objectives, environmental ruggedness for site conditions, and built-in data processing capabilities. Teams should also evaluate total cost of ownership including software licensing, maintenance, and training. For long-term remote deployments, low power consumption and autonomous operation are critical.