Welcome to Geotech!
Trans-hole ERT vs TEM: Comparative Analysis for Hydrogeological Surveys
Introduction to Subsurface Imaging Techniques
The high-density resistivity method operates on identical principles to conventional DC resistivity methods, utilizing artificial current-induced electric field variations to detect geological anomalies through resistivity contrasts in underground media. Key factors affecting resistivity measurements include rock composition, porosity, hydraulic connectivity, and metallic content. This study demonstrates the integrated application of Cross-Hole Electrical Resistivity Tomography (ERT) and Transient Electromagnetic Method (TEM) for advanced geotechnical investigation.
1. Project Overview: Cross-Hole ERT & TEM for Geotechnical Site Investigation
This geophysical survey employed:
- Dual-borehole configuration: 40m depth, 18m spacing
- Water-bearing zone detection: Verified through cross-hole ERT measurements
- Advanced instrumentation:
- Waterproof cables with 1m electrode spacing (30 electrodes/hole)
- Geotech’s high-power TEM system validation
- Central loop configuration:
- Transmitter: 1m diameter/30-turn coil
- Receiver: 0.2m diameter/30-turn coil
- 30A maximum current
- 2m station spacing along 24m survey line
2. Geophysical Equipment Specifications
2.1 Geotech WGMD High-Density Electrical System
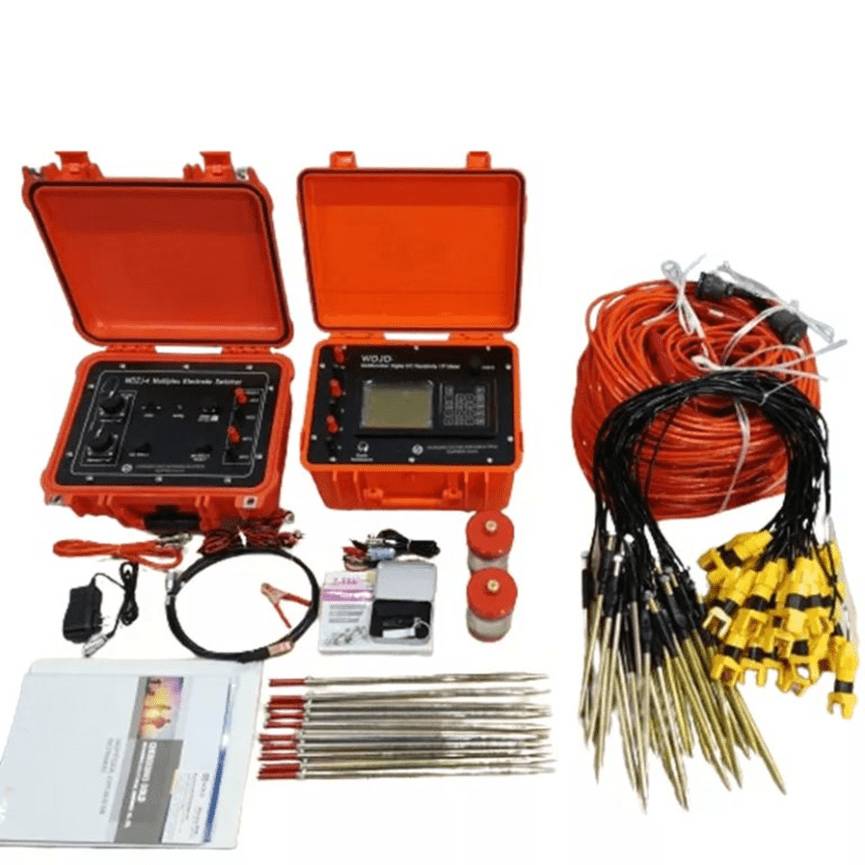
Key Features:
- Subsurface resistivity profiling with 4D imaging capability
- Bluetooth-enabled data transmission
- 4G remote monitoring & real-time acquisition
Technical Specifications:
- Automatic SP/drift compensation
- Expandable to 500 measurement channels
2.2 Cross-Hole CT Workflow Optimization
- Software initialization & Bluetooth pairing
- Project creation: Select “Cross-Hole CT” + “Centralized Cable”
- Parameter input:
- Electrodes per side
- Inter-electrode spacing
- Borehole separation
- Top electrode depth
- Data conversion to .txt format post-survey
2.3 TEM System
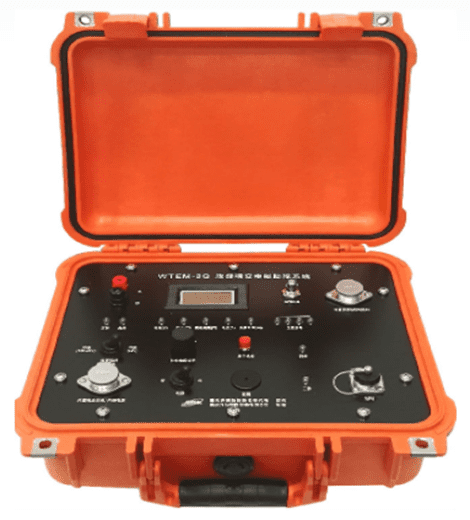
Performance Advantages:
- High-power transmission capabilities
- Fast current shutdown (μs-range)
- Enhanced noise immunity
- Field-portable design
3. ERT Methodology Deep Dive
3.1 High-Density Resistivity Fundamentals
The technique analyzes spatial electric field variations under controlled current injection, resolving geological structures through resistivity contrasts. Critical parameters include:
- Lithology variations
- Porosity distribution
- Pore network connectivity
- Metallic mineralization
3.2 Basic principles of resistivity measurement
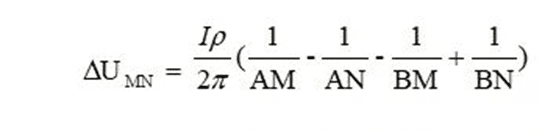
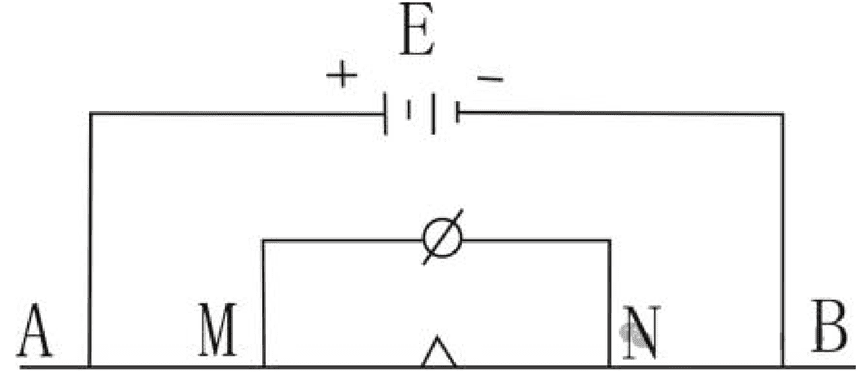
For resistivity measurement, it is assumed that the earth resistivity is uniform in the area to be measured. For measuring uniform earth resistivity values, in principle, any form of electrode arrangement can be used, that is, power is supplied at any two points (A, B) on the surface, and then the potential difference between them is measured at any two points (M, N). According to formula (3-1), the potential of points M and N can be calculated (Figure 3.1).
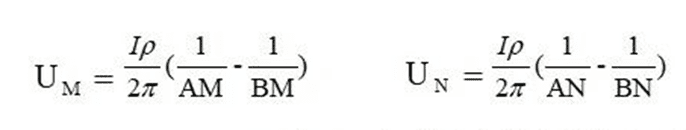
Formula (3-1) is the basic formula for measuring resistivity on the surface of a uniform earth using any electrode device (or electrode arrangement). K is the electrode device coefficient (or electrode arrangement coefficient), which is a physical quantity related only to the spatial position of the electrode. Considering the actual needs, in electrical prospecting, the power supply electrode and the measuring electrode are usually placed in a straight line.

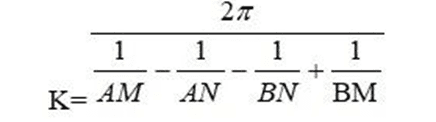
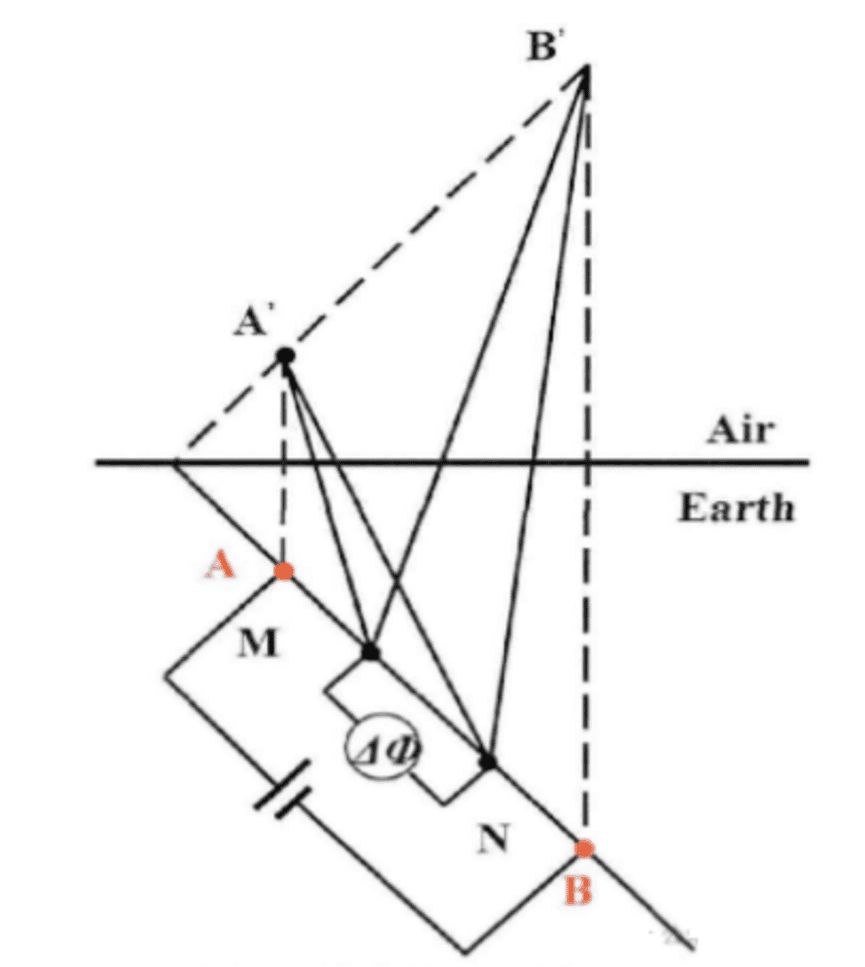
In the actual process of inter-well high-density electrical method, due to the influence of the surface boundary, the space above the electrode is not a uniform infinite space. When calculating the inter-well array device coefficient, the mirror method needs to be used. As the name implies, the electric potential generated by the point source below the ground can be regarded as the electric potential generated by the point source and the same point source symmetrical with the ground as the symmetry plane in a uniform infinite space (3.5). As shown in Figure 3.2, the potential difference between electrodes M and N is equal to the influence of the electric field generated by electrodes A and B and their symmetrical electrodes A’ and B’. From this, we derive the device coefficient calculation formula for the inter-well high-density electrical method array as follows:

4. TEM Technology Explained
The transient electromagnetic method (TEM) is a time domain electromagnetic method (pulsed field source) that uses an ungrounded loop to emit a pulsed primary electromagnetic field into the ground, and uses a coil to observe the spatial and temporal distribution of the secondary electromagnetic field generated by the underground eddy current induced by the electromagnetic induction of the pulse, thereby solving relevant geological problems (see Figure 4.1).

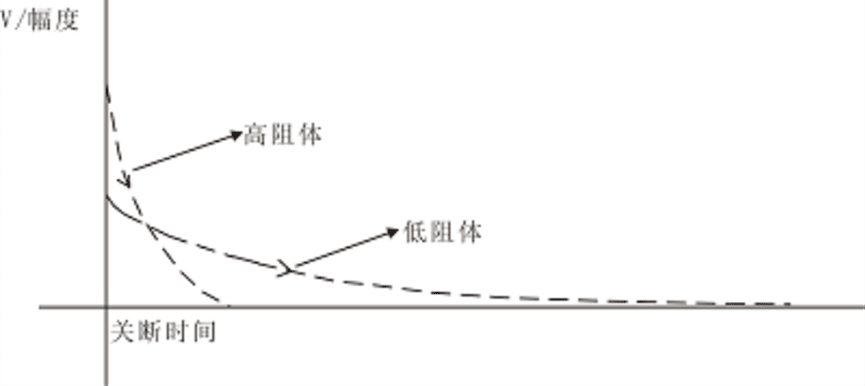
Observe the changes of the induced electromagnetic field with time and space after power failure. The delay time characteristics of the transient field are related to the geometric parameters and electrical parameters of the underground geological body. The larger the scale of the good conductive geological body and the better the conductivity, the greater the intensity of the transient field, the slower the decay, and the longer the delay time; conversely, the intensity of the transient field is small, the decay is fast, and the delay time is short (see Figure 4.2). The induced electromagnetic field strength reflects the time and depth of the conductive power failure.
5. Geophysical Data Interpretation
5.1 ERT Inversion Results
Res2dinv software processing revealed:
- Original vs. logarithmic resistivity contrast
- Enhanced low-resistivity anomaly resolution after log transformation
- Vertical smearing reduction through 2D Surfer visualization

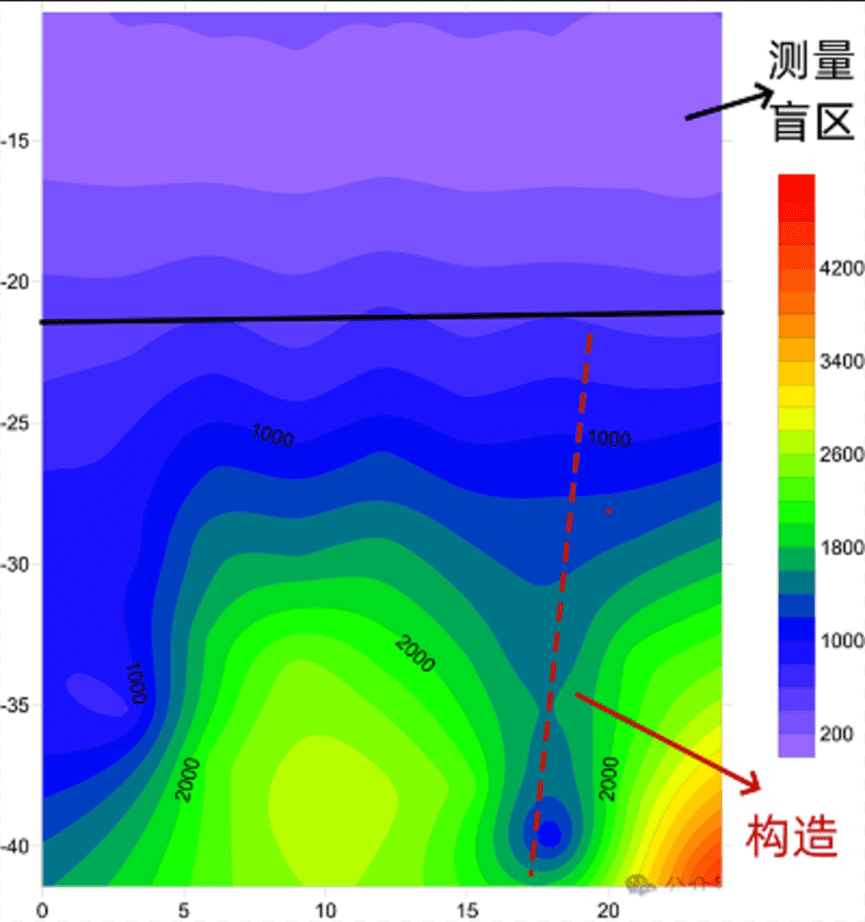
5.2 TEM Data Analysis
- 20m early-time blind zone (high-current transmission)
- 16m lateral low-resistivity anomaly identification
- Distinction between anthropogenic fill (0-2m) vs. fractured sandstone
5.3 Integrated Geophysical Interpretation
| Method | Strengths | Limitations |
| Cross-Hole ERT | High data density | Limited depth resolution |
| TEM | Deep penetration | Shallow blind zone |
Conclusion: Advanced Geophysical Solutions for Hydrogeological Characterization
This integrated ERT-TEM approach demonstrates superior anomaly detection through:
- Multi-dimensional resistivity imaging
- Time-domain electromagnetic profiling
- Joint inversion uncertainty reduction
For geotechnical engineers and hydrogeologists seeking to optimize site investigations, combining cross-hole electrical tomography with transient electromagnetic surveys provides complementary datasets for robust subsurface characterization.
To learn more about ERT, please go to the following link:
Geotech Products| Geotech Instrument Co., Ltd. (geotechcn.net)