Welcome to Geotech!
-1.png)


Comparative Study of Geophysical Exploration Methods: HDR, ERT & DC
TIPS:High-density electrical resistivity and electrical resistivity tomography are the leading geophysical methods for subsurface imaging. This guide compares high-density electrical resistivity with electrical resistivity tomography, DC sounding, and 2D/3D imaging. Learn which method fits your project using real case data and Geotech GIM system specifications.
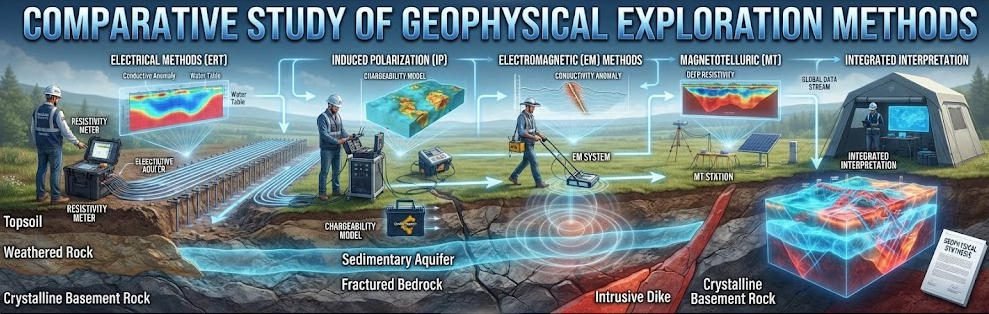
Ⅰ. Choosing the Right Resistivity Method
Subsurface investigations demand precision. The wrong geophysical method wastes budget and time. Resistivity-based techniques offer a proven path. They detect water, minerals, voids, and contamination without drilling.
Four methods dominate the field today:
- DC Resistivity Sounding — 1D vertical profiling
- High-Density Resistivity (HDR) — Automated 2D cross-sections
- 2D/3D Electrical Resistivity Imaging — Multi-line spatial mapping
- Electrical Resistivity Tomography (ERT) — High-resolution 3D volumes
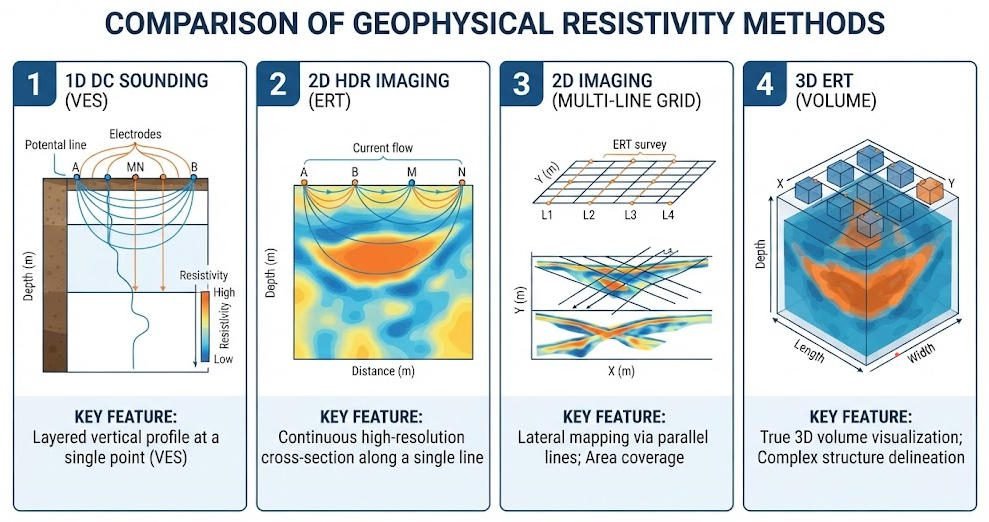
Each method solves different problems. DC sounding probes deep with minimal gear. HDR covers ground fast with dense data. 2D imaging balances speed and detail. ERT reveals complex structures in true 3D.
This article breaks down every method. You will see how each works, where it excels, and how to choose the right tool for your target.
Ⅱ. DC Resistivity Sounding: The Foundation
1.How It Works
DC sounding uses four electrodes. Two inject current. Two measure voltage. Crews expand the spacing between electrodes to probe deeper layers.
The method builds a 1D vertical profile. It shows how resistivity changes with depth. It assumes horizontal layering. This makes it ideal for flat, stratified geology.
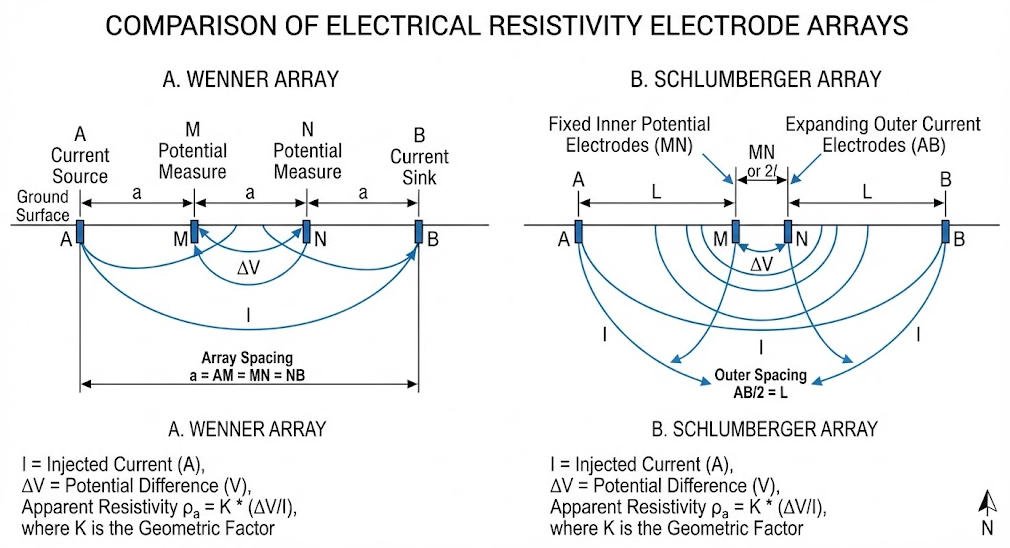
The apparent resistivity formula is simple:
ρa = k × ΔV / I
Where ρa is apparent resistivity, k is the geometric factor, ΔV is measured voltage, and I is injected current.
Wenner arrays use equal spacing. They work best in homogeneous ground. Schlumberger arrays fix the inner potential electrodes. They expand the outer current electrodes. This suits deep surveys where layer thickness varies.
2.Where It Fits
DC sounding excels at reconnaissance. It maps bedrock depth across large areas. It identifies aquifer boundaries. It costs little and needs minimal training.
In Hangzhou, engineers combined DC sounding with borehole data. They reduced bedrock mapping errors below 5%. The method pinpointed aquifer-confining layer interfaces through vertical resistivity gradients.
Limitations are clear. DC sounding cannot detect lateral changes. A vertical profile at one point misses faults, cavities, or dipping beds nearby. It also requires manual electrode movement. Field speed is slow.
Ⅲ. High-Density Resistivity: Speed Meets Resolution
1.The Automated Advantage
HDR places dozens of electrodes in a single line. A central controller switches pairs automatically. One setup collects thousands of data points. No manual electrode movement is needed.
This automation transforms field efficiency. A crew can survey 500 meters in a single day. Traditional DC methods cover only a few points in the same time.
HDR supports multiple configurations. Wenner-alpha provides excellent vertical resolution. Dipole-dipole detects lateral changes. Combined arrays capture both in one deployment.
Real-time pseudosections appear on the controller screen. Crews see data quality instantly. They spot bad electrodes or noisy sections before leaving the site.
2.Field-Proven Results
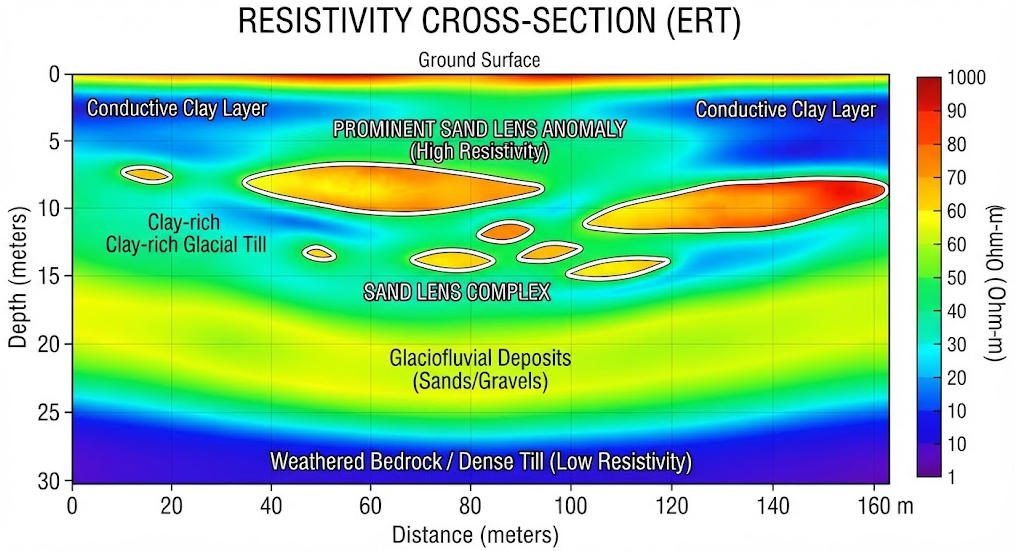
In Xiong’an New Area, crews deployed 64-channel HDR systems with 5 m spacing. They ran 13 east-west lines and 8 north-south lines. Wenner-alpha configuration produced clear resistivity depth slices. Res2Dinv inversion revealed interconnected sand lenses and paleochannel networks. This data guided urban planning and foundation design.
Urban pipeline surveys combine HDR with GPR. HDR maps soil resistivity. GPR locates metallic pipes. Together they resolve cast iron pipeline interference that either method alone would miss.
HDR depth typically reaches 100 m. Beyond this, electrode spacing becomes impractical. Surface coupling also affects data quality on concrete or bedrock.
Ⅳ. 2D/3D Electrical Resistivity Imaging: Spatial Mapping
1.From Lines to Volumes
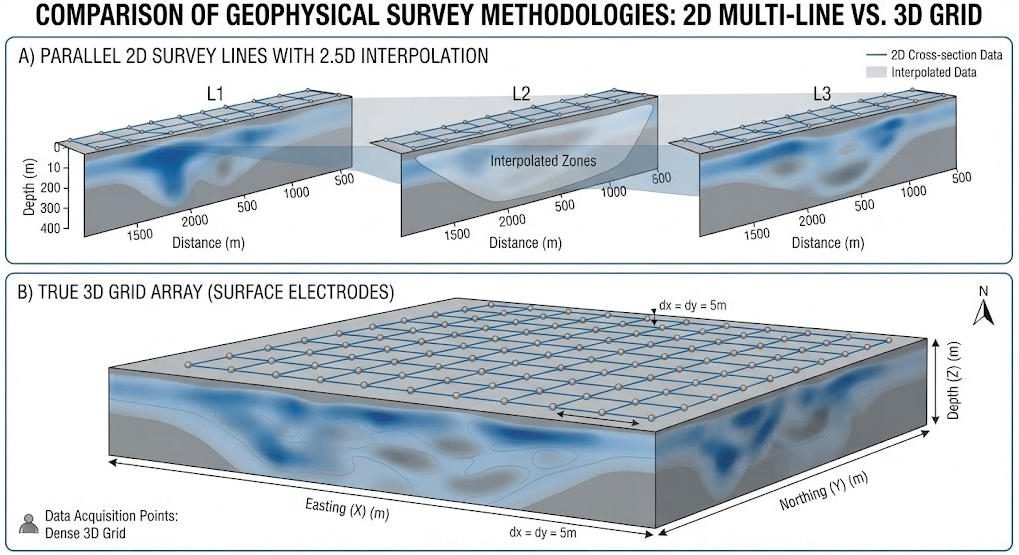
2D imaging extends HDR principles. Multiple parallel lines create a spatial dataset. Software interpolates between lines. The result is a resistivity volume.
3D imaging uses grid arrays. Electrodes deploy in a 10×10 or larger grid. The instrument collects data across all combinations. Inversion produces a true 3D model.
2D assumes no lateral variation between lines. This speeds processing. A single profile inverts in about 5 minutes using RES2DINV. However, 2D can misrepresent 3D anomalies. A spherical cavity appears distorted on a 2D line.
3D requires more effort. Setup takes longer. Data volume is massive. TOMO3D software uses GPU acceleration. Runtime exceeds 2 hours. Resolution improves by 40% over 2D.
2.Applications in Practice
In Jinan, engineers used 2D imaging near Baotu Spring. Surface wave analysis combined with resistivity data mapped groundwater channels. This guided metro construction routing. It prevented unexpected water inflow during tunneling.
Xi’an ground fissure surveys used reflection tomography. 2D imaging located near-surface fissures before construction. Early detection saved millions in foundation repair costs.
Ⅴ. Electrical Resistivity Tomography: The 3D Standard
1.Cross-Hole and Surface-to-Borehole ERT
ERT pushes resolution to the limit. It places electrodes in boreholes. Spacing ranges from 1 to 5 meters. Current flows between boreholes. Voltage measurements build inter-well images.
Cross-hole ERT excels at complex sites. Landfill leakage pathways, mine voids, and fault zones appear in true 3D. Fluid conductivity monitoring adds temporal data. Time-lapse ERT tracks plume migration.
Surface-to-borehole ERT combines surface arrays with downhole electrodes. This extends coverage beyond what surface arrays alone can achieve. It bridges the gap between shallow imaging and deep borehole logging.
2.Case Study: Landfill Leakage
A European landfill used cross-hole ERT. Electrodes in multiple boreholes surrounded the waste cell. 3D inversion mapped conductive plumes escaping the liner. Fluid conductivity sensors in monitoring wells confirmed the ERT model. Remediation teams targeted exactly the right zones. Cleanup costs dropped significantly.
Archaeological sites benefit too. Surface ERT in Italy imaged Roman-era structures at 0.5 m resolution. Non-invasive mapping preserved the site while revealing buried walls and chambers.
Ⅵ. Four-Method Comparison
| Parameter | DC Sounding | HDR | 2D Imaging | 3D ERT |
|---|---|---|---|---|
| Data Dimension | 1D vertical | 2D profile | 2D/3D volume | 3D volume |
| Resolution | Low (5–10 m) | Medium-High (0.5 m) | High (0.3 m) | Very High (0.2 m) |
| Depth Range | 50–200 m | 10–100 m | 5–50 m | 5–150 m |
| Data Density | Sparse | Dense | Dense | Ultra-Dense |
| Field Efficiency | Low | High | Medium-High | Low |
| Cost | Low | Medium | Medium-High | High |
| Noise Immunity | Weak | Medium | Medium-High | High |
| Best For | Bedrock depth | Urban engineering | Fault detection | Mine leakage |
Use DC sounding for regional reconnaissance. Use HDR for linear engineering surveys. Use 2D imaging for corridor mapping. Use 3D ERT for complex sites requiring volumetric detail.
Ⅶ. Forward and Inverse Modeling Explained
1.Forward Modeling
Forward modeling predicts what data should look like. You assume a subsurface model. Software calculates the theoretical resistivity response.
Finite Element Method (FEM) handles complex geometry. Finite Difference Method (FDM) suits layered earth. RES2DMOD simulates 2D HDR responses in minutes. COMSOL Multiphysics models 3D ERT with anisotropy support.
Forward modeling helps survey design. It tests whether your planned array can resolve the target. If the predicted response is too weak, you adjust spacing or configuration before fieldwork begins.
2.Inverse Modeling
Inverse modeling converts field data into geological models. It is the core of modern resistivity interpretation.
Smoothness-constrained inversion (Occam’s algorithm) produces gradual models. It avoids over-interpreting noise. This is the default for HDR and 2D imaging.
Structure-coupled inversion uses L1-norm regularization. It enhances sharp boundaries. Edges of cavities, faults, and layers appear clearer. This suits ERT where geological contacts are abrupt.
AI is entering this space. CNN-based inversion reduces runtime by 70%. Neural networks trained on synthetic data invert field datasets in seconds. Geotech’s GIM Studio integrates these advances.
Ⅷ. Geotech GIM Series: Engineered for Every Method
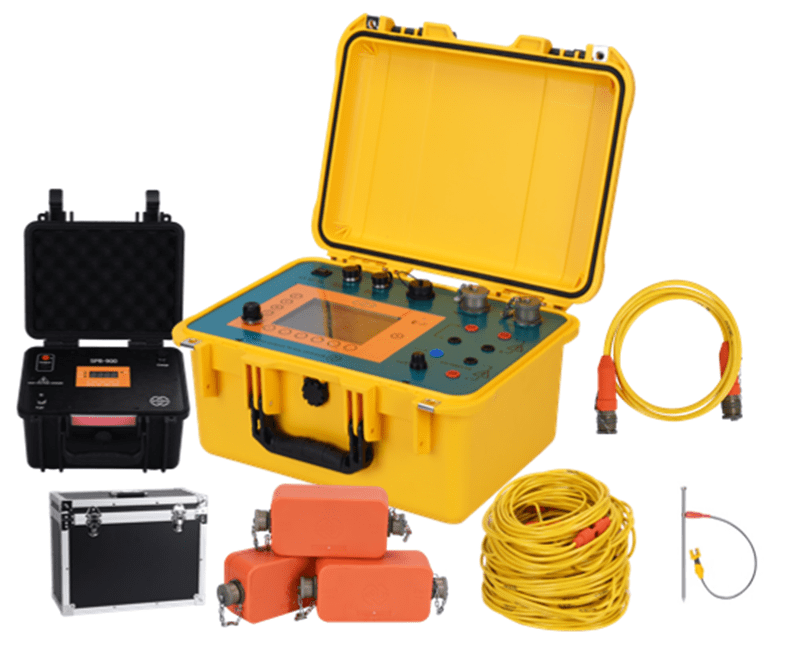
The GIM Series integrates DC resistivity and induced polarization. It supports 12 electrode configurations. It handles 1D, 2D, 3D, and 4D time-lapse surveys.
The flagship GIM-10 system achieves 0.3% accuracy. Its 24-bit A/D conversion and ±48 V range handle complex terrain. A 3,200 W high-voltage transmitter module reaches 1,500 m depth.
Key innovations include:
- Intelligent expansion: Bidirectional cascade controllers enable unlimited line extensions
- Multi-scenario detection: Ground, cross-hole, borehole-surface, and underwater modes
- IP67 housing: Titanium alloy electrodes operate from -20°C to 60°C
- 12-channel acquisition: 50% faster field efficiency than single-channel systems
Reference Sources
| Authority | Source URL |
|---|---|
| U.S. Environmental Protection Agency (EPA) — Electrical Resistivity | https://www.epa.gov/environmental-geophysics/electrical-resistivity |
| National Center for Biotechnology Information (NCBI/PMC) — ERT Applications | https://pmc.ncbi.nlm.nih.gov/articles/PMC10039044/ |
| Society of Exploration Geophysicists (SEG) | https://seg.org/ |
| International Union of Geological Sciences (IUGS) | http://www.iugs.org/ |
| Geotech Instrument Co., Ltd. — ERT Instruments Guide | https://geotechcn.net/service/ert-instruments/ |
Related Articles
Explore related Geotech resources for your geophysical projects:
- What Is an ERT Instrument? A Comprehensive Guide
- Underground Electrical Exploration Methods Compared
- What Is Electrical Resistivity Tomography? ERT Guide
- Comparative Study of Underground Electrical Exploration Methods
- ERT vs TEM: Which Geophysical Method Fits Your Project?
- Induced Polarization Method for Mineral Exploration
- Geophysical Exploration Classification & Applications
- GIM Series Intelligent Resistivity & IP Meter Product Page
FAQ
Q1: What is the difference between HDR and ERT?
A: HDR is a specific type of automated resistivity survey using dense surface electrode arrays. ERT is a broader term that includes surface, cross-hole, and borehole configurations for 2D or 3D imaging. All HDR surveys are a form of ERT, but not all ERT uses high-density surface arrays. ERT can also use sparse borehole electrodes.
Q2: When should I choose DC sounding over HDR?
A: Choose DC sounding for deep reconnaissance beyond 100 m. It reaches 200 m with simple equipment. It costs less and needs less setup time. Choose HDR when you need lateral detail, dense data coverage, or real-time imaging. HDR excels at shallow engineering surveys under 100 m.
Q3: Can 2D resistivity imaging detect 3D structures accurately?
A: 2D imaging assumes the geology does not change perpendicular to the survey line. This assumption fails near 3D anomalies like spherical cavities or inclined faults. The 2D image will show a distorted anomaly. For reliable 3D mapping, use true 3D ERT with grid arrays or multiple parallel lines with 3D inversion.
Q4: How does AI improve resistivity data processing?
A: AI, specifically convolutional neural networks, trains on synthetic resistivity models. It learns to invert data without iterative calculations. This reduces processing time by 70%. It also handles noisy data better than traditional algorithms. Geotech’s GIM Studio integrates CNN-based inversion for rapid field interpretation.
Q5: What is the maximum depth for each resistivity method?
A: DC sounding reaches 50–200 m depending on array size and power. HDR typically probes 10–100 m. 2D imaging covers 5–50 m for standard setups. 3D ERT ranges from 5–150 m depending on borehole depth and electrode spacing. For targets beyond 200 m, consider electromagnetic methods like TEM.