Welcome to Geotech!
-1.png)


How to Conduct a Groundwater Survey: A Technical Guide to Accurate Results
TIPS:A professional groundwater survey eliminates blind borehole drilling while an accurate electrical resistivity survey locates high-yield aquifers efficiently. Every reliable groundwater survey relies on calibrated geophysical hardware, and a standardized electrical resistivity survey minimizes false subsurface anomalies for farm, industrial and municipal water projects.
Ⅰ. Executive Summary
Groundwater survey accuracy directly determines drilling success rates and project economics. Electrical resistivity survey (ERS) technology remains the most trusted method for pre-drilling aquifer assessment. This technical guide explains how to conduct a groundwater survey that delivers reliable results. Geotech Instrument Co., Ltd. designs precision ERT and geophysical instruments used by survey teams across six continents. A professionally executed groundwater survey eliminates guesswork. It transforms uncertain drilling into data-driven decisions. Modern resistivity meters achieve borewell success rates exceeding 90% when combined with proper field protocols.
Ⅱ. Understanding Groundwater Survey Fundamentals
1. What Defines a Professional Groundwater Survey
A groundwater survey is a systematic geophysical investigation. It identifies subsurface water-bearing formations before any drilling occurs. The process maps aquifer geometry, estimates water depth, and predicts yield potential. It also evaluates geological risks that could affect borewell performance.
Professional surveys differ fundamentally from traditional water-finding methods. Dowsing rods and local intuition lack scientific validation. Failure rates for unscientific approaches reach 50% to 80%. In contrast, geophysical surveys measure actual physical properties of the subsurface. They provide quantitative data for informed decision-making.
2. The Economic Case for Pre-Drilling Surveys
Drilling a dry borehole wastes capital and time. A single failed well in hard-rock terrain can cost $5,000 to $30,000. This includes mobilization, drilling labor, casing materials, and site restoration. For commercial or agricultural projects, multiple dry holes compound losses significantly.
Geophysical surveys reduce this risk dramatically. Professional ERS surveys achieve 85% to 95% accuracy in locating productive aquifers. The survey cost typically represents 3% to 8% of total drilling expenditure. This small investment prevents catastrophic drilling failures. It also optimizes pump selection and borewell depth design.
| Survey Approach | Typical Success Rate | Relative Cost | Risk Level |
|---|---|---|---|
| No survey (blind drilling) | 30%–50% | Baseline | Very High |
| Traditional methods | 40%–60% | Low | High |
| Single-method geophysics | 70%–85% | Medium | Moderate |
| Integrated ERS + validation | 85%–95% | Medium-High | Low |
3. Core Physical Principles
Groundwater surveys exploit measurable contrasts in subsurface physical properties. Water-saturated rocks and soils behave differently than dry materials. Geophysical instruments detect these differences at the surface.
Electrical resistivity methods measure how strongly materials oppose electric current. Water reduces resistivity significantly. Clay minerals also lower resistivity. This overlap requires careful interpretation. Seismic methods measure elastic wave velocities. Saturated formations transmit waves faster than dry equivalents. Electromagnetic methods detect conductivity variations without direct ground contact.
Understanding these principles helps survey teams select appropriate methods. It also enables realistic accuracy expectations for different geological settings.
Ⅲ. Step-by-Step Groundwater Survey Workflow
1. Preliminary Site Assessment and Reconnaissance
Every successful survey begins with thorough surface reconnaissance. Field teams examine terrain morphology and drainage patterns. They identify surface depressions that may indicate subsurface fracture zones. They also review historical land use that could introduce cultural interference.
Key reconnaissance tasks include:
- Mapping surface rock outcrops and soil types
- Identifying existing wells and their yield history
- Locating power lines, pipelines, and buried metal structures
- Assessing access routes for equipment mobilization
- Documenting seasonal water table fluctuations from local sources
This preliminary data guides survey line placement. It also helps predict potential data quality issues before fieldwork begins.
2. Geological and Hydrogeological Data Compilation
Regional geological understanding provides critical context for geophysical interpretation. Survey teams compile existing data from geological surveys, academic studies, and government databases. This information establishes realistic expectations for aquifer depth and characteristics.
Essential background data includes:
- Regional stratigraphy and rock formations
- Known fault systems and fracture trends
- Historical rainfall patterns and recharge rates
- Existing borehole logs from nearby locations
- Water chemistry data indicating aquifer type
In hard-rock terrains, weathering depth controls shallow aquifer occurrence. In sedimentary basins, sand-clay sequences determine aquifer geometry. Each geological setting demands tailored survey strategies.
3. Geophysical Data Acquisition
3.1 Electrical Resistivity Survey (ERS) Deployment
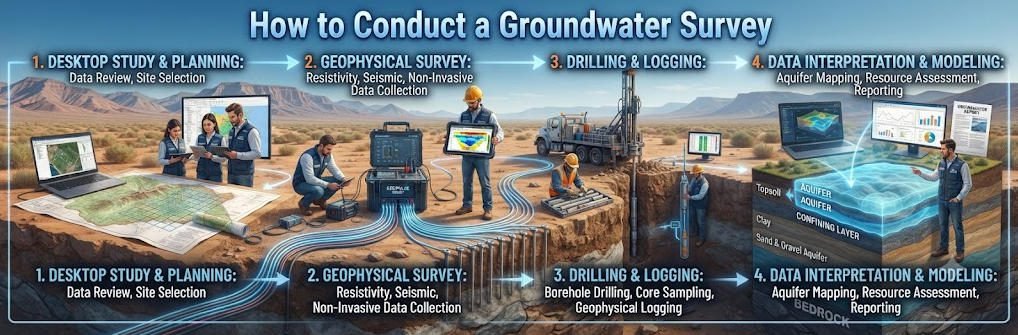
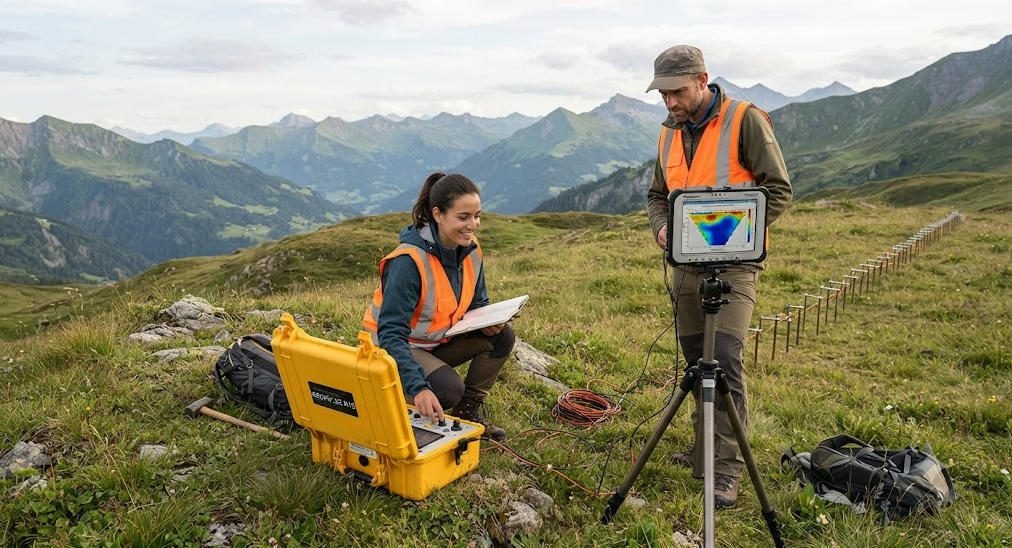
ERS forms the backbone of most groundwater surveys. The technique injects direct current into the ground through electrode arrays. It measures resulting voltage differences across the array. Modern instruments use multi-electrode cables with automated switching systems.
Field crews deploy electrodes along profile lines at regular spacing. Common configurations include Wenner, Schlumberger, and dipole-dipole arrays. Array selection depends on target depth and geological complexity. Wenner arrays provide strong signals for shallow investigations. Schlumberger arrays balance depth penetration with lateral resolution.
For groundwater applications, low-resistivity zones typically indicate:
- Saturated porous formations
- Weathered or fractured rock containing water
- Clay-rich layers (requires IP data for discrimination)
- Saline groundwater (extremely low resistivity)
3.2 Multi-Method Integration
Single-method surveys carry inherent ambiguity. Resistivity alone cannot distinguish clay from freshwater. Seismic data alone cannot confirm water saturation. Integrating multiple methods reduces uncertainty significantly.
Common combinations include:
- ERS + IP: Distinguishes clay layers from water-bearing zones
- ERS + GPR: Maps shallow detail where GPR signal permits
- ERS + Seismic: Defines bedrock depth controlling reservoir volume
- VES + TEM: Extends depth range beyond standard ERS limits
Multi-method surveys increase field costs by 20% to 40%. However, they improve interpretation confidence. They also reduce the risk of expensive drilling mistakes.
4. Data Processing and Quality Control
4.1 Inversion and Modeling
Raw field data requires computational inversion to produce subsurface images. Inversion algorithms convert measured apparent resistivities into true resistivity distributions. Modern software uses smoothness-constrained least-squares optimization.
Quality indicators include:
- RMS error: Should typically fall below 5% for reliable results
- Iteration count: Convergence within 3 to 6 iterations indicates stable solutions
- Model roughness: Excessive roughness suggests overfitting or noisy data
- Data misfit distribution: Random misfits indicate good fits; systematic patterns reveal model deficiencies
4.2 Error Sources and Mitigation
Several factors compromise survey accuracy. Understanding these errors enables proactive mitigation:
| Error Source | Impact | Mitigation Strategy |
|---|---|---|
| Electrode contact resistance | Noisy data, poor signal | Use saltwater sponges, drive electrodes deeper |
| Topographic effects | Distorted depth estimates | Include elevation data in inversion |
| Cultural interference | False anomalies | Survey away from power lines, pipelines |
| Array geometry errors | Systematic artifacts | Use GPS positioning, verify electrode spacing |
| Seasonal variations | Time-dependent results | Survey during stable hydrological periods |
5. Interpretation and Aquifer Delineation
5.1 Lithological Correlation
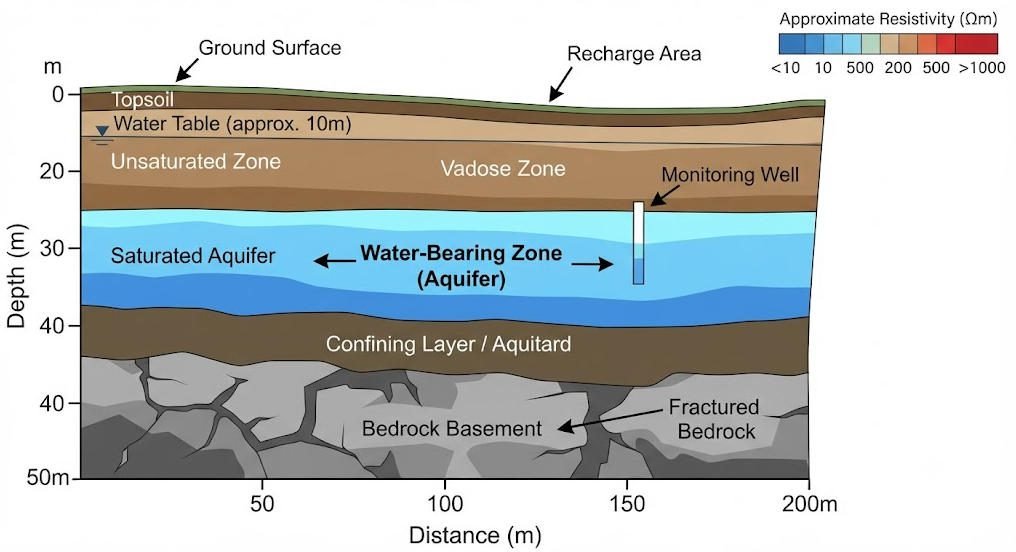
Geophysicists correlate resistivity values with known lithologies from regional data. Typical resistivity ranges guide initial interpretation:
- Freshwater sand/gravel: 20–500 Ω·m
- Clay/silt: 1–50 Ω·m
- Weathered rock: 50–500 Ω·m
- Fresh bedrock: >500 Ω·m
- Saline water: <10 Ω·m
These ranges vary with pore fluid chemistry, temperature, and clay content. Local calibration using existing borehole data improves accuracy substantially.
5.2 Aquifer Characterization
Interpretation targets specific hydrogeological parameters:
- Aquifer top depth: The upper boundary of sustained low resistivity
- Aquifer thickness: Vertical extent of the water-bearing zone
- Basement depth: The lower confining boundary
- Fracture orientation: Linear anomalies indicating structural controls
- Yield potential: Inferred from aquifer thickness and resistivity contrast
6. Reporting and Drilling Recommendations
6.1 Survey Report Components
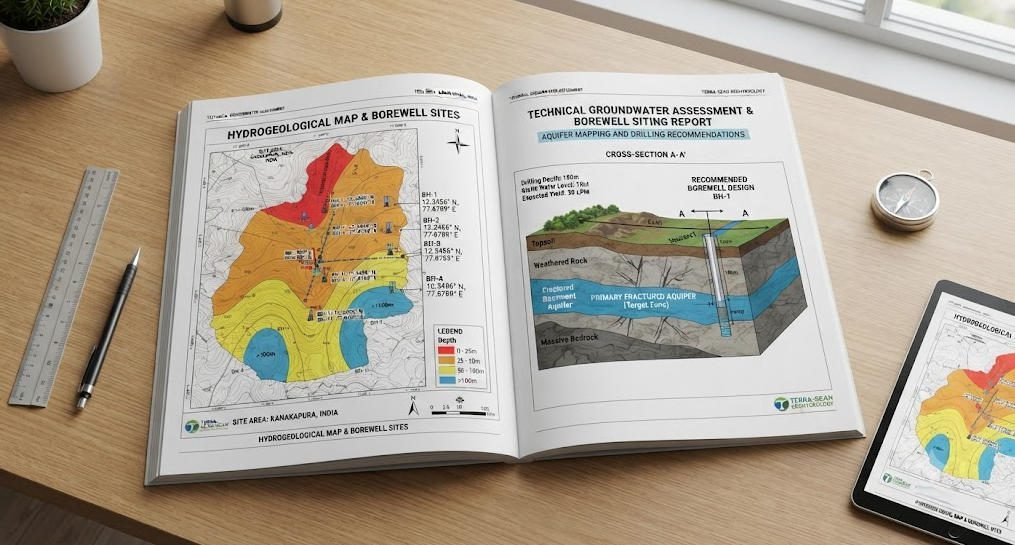
A professional groundwater survey report includes:
- Executive summary with success probability estimates
- Geological and hydrogeological background
- Survey methodology and equipment specifications
- Processed resistivity sections with interpretation overlays
- Recommended drilling locations with GPS coordinates
- Expected depth ranges and yield estimates
- Risk assessment and contingency recommendations
6.2 Drilling Point Selection Criteria
Optimal drilling points satisfy multiple criteria:
- Located within low-resistivity anomaly centers
- Positioned away from interpreted clay bodies
- Aligned with regional fracture trends where applicable
- Accessible for drilling equipment
- Sufficiently distant from existing wells to avoid interference
Ⅳ. Ensuring Survey Accuracy and Reliability
1. Equipment Selection and Calibration
Instrument quality directly affects data reliability. Key selection criteria include:
- Measurement precision: 24-bit A/D conversion for microvolt resolution
- Dynamic range: Ability to measure both strong and weak signals accurately
- Channel count: Higher counts enable denser arrays and faster acquisition
- Environmental rating: IP67 protection for challenging field conditions
- Software compatibility: Open data formats supporting standard inversion packages
Annual calibration against traceable standards maintains accuracy. Drift exceeding 3% invalidates year-to-year comparisons. Geotech instruments undergo rigorous factory calibration before shipment.
1.1 Resistivity Meter Specifications for Groundwater Work
Groundwater surveys demand specific instrument capabilities. The ideal resistivity meter offers:
- Minimum 10-channel simultaneous acquisition
- IP measurement capability for clay discrimination
- Built-in GPS for electrode positioning
- Real-time contact resistance monitoring
- Ruggedized construction for remote deployment
- Battery life supporting full 8-hour field days
1.2 Electrode and Cable Considerations
Stainless steel electrodes resist corrosion in diverse soils. Cable length determines maximum array span. For 200-meter target depth, deploy 1,000-meter cables with 5-meter electrode spacing. Cable weight becomes a logistical factor on steep terrain. Multi-core cables with Kevlar reinforcement withstand field abuse.
2. Field Protocol Best Practices
2.1 Site Preparation
Clear survey lines of vegetation and debris. Mark electrode positions precisely using GPS or tape measures. Test contact resistance before data acquisition begins. Values below 10 kΩ generally ensure good data quality.
2.2 Data Acquisition Standards
Acquire reciprocal measurements for quality verification. Reciprocal errors below 5% indicate reliable data. Record ambient noise levels during acquisition. Repeat noisy stations under improved conditions.
2.3 Seasonal Considerations
Groundwater levels fluctuate seasonally. Post-recharge periods often provide the most representative data. Avoid surveys during extreme drought when water tables drop below typical levels. In monsoon climates, allow time for infiltration stabilization after heavy rains.
3. Personnel Competency Requirements
Accurate interpretation requires formal geophysical training. Certified operators understand array theory and inversion limitations. They recognize acquisition artifacts that untrained personnel might misinterpret as geological features.
Minimum competency standards include:
- Formal training in electrical geophysics principles
- Field experience with specific instrument models
- Proficiency in at least one commercial inversion software
- Understanding of local hydrogeological conditions
4. Validation Through Borehole Correlation
The ultimate test of survey accuracy comes from drilling validation. Compare predicted aquifer depths with actual borehole encounters. Document prediction errors systematically. Use these comparisons to refine local interpretation guidelines.
Long-term validation databases improve regional accuracy. They also build confidence in geophysical methods among drilling contractors and project stakeholders.
Ⅴ. Advanced Techniques for Complex Terrains
1. Hard-Rock Fractured Aquifers
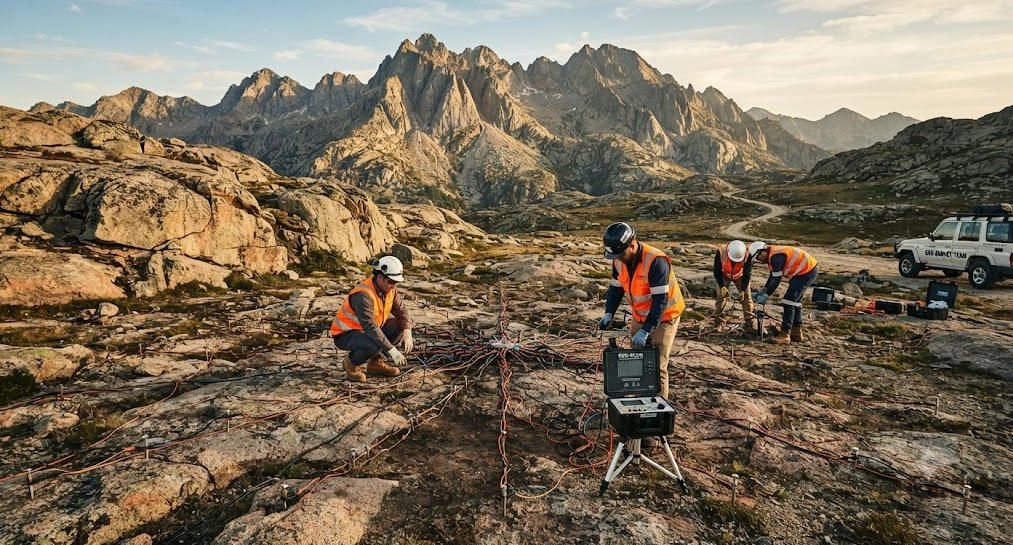
Crystalline basement rocks host groundwater in weathered zones and fractures. Standard ERS profiles may miss narrow fracture zones. Specialized approaches include:
- Azimuthal resistivity surveys: Detect anisotropy indicating fracture orientation
- Very dense arrays: 1-meter electrode spacing for shallow fracture mapping
- Borehole ERT: Cross-hole imaging between existing wells
In granitic terrains, weathered mantle thickness ranges from 5 to 30 meters. Fractured zones below this layer provide the primary water supply. Accurate fracture mapping requires dense electrode spacing and careful array orientation.
2. Saline-Freshwater Interface Mapping
Coastal aquifers face saltwater intrusion risks. ERT excels at mapping saline-freshwater interfaces. The sharp resistivity contrast creates clear boundaries. Time-lapse monitoring tracks interface migration during pumping or sea-level changes.
Saline water typically registers below 10 Ω·m. Freshwater aquifers show 20 to 500 Ω·m. The transition zone spans a narrow vertical interval. Mapping this interface supports sustainable pumping limits. It also protects agricultural lands from salinization.
3. Deep Aquifer Exploration
Standard ERS reaches 100 to 500 meters depending on array length. For deeper targets, transient electromagnetic (TEM) methods extend range to 800+ meters. Controlled-source audio magnetotellurics (CSAMT) achieves even greater depths. These methods sacrifice some resolution for penetration.
Deep aquifer exploration supports industrial water supply projects. It also identifies backup sources for municipal systems. Integration of surface geophysics with limited borehole data optimizes deep exploration economics.
4. Time-Lapse Monitoring for Sustainability
Repeat surveys track seasonal aquifer changes. Time-lapse ERT monitors drawdown during pumping tests. It also identifies recharge boundaries for aquifer protection. This monitoring capability supports sustainable groundwater management under climate stress.
Communities use time-lapse data to enforce withdrawal limits. Regulators identify over-exploited zones requiring restrictions. Farmers optimize irrigation scheduling based on real-time aquifer conditions.
Reference Sources
| Organization | URL |
|---|---|
| U.S. Geological Survey (USGS) Water Resources | https://www.usgs.gov/mission-areas/water-resources |
| U.S. Environmental Protection Agency (EPA) – Accuracy of Depth to Water Measurements | https://www.epa.gov/sites/default/files/2015-06/documents/accur_depth_water.pdf |
| Nature – Application of ERT in Groundwater Detection on Loess Plateau | https://www.nature.com/articles/s41598-023-31952-7 |
| Frontiers in Water – ERT, EM and GPR Methods for Groundwater Recharge | https://www.frontiersin.org/journals/water/articles/10.3389/frwa.2025.1636613/full |
| UNICEF/Oxfam – Guidance on Groundwater Infrastructure Resilience | https://www.oxfamwash.org/wp-content/uploads/Guidance-Note-5-Improving-the-Resilience-of-Groundwater-Infrastructure-to-Climate-Change.pdf |
FAQ
Q1.What is the success rate of a professional groundwater survey?
Professional groundwater surveys using electrical resistivity methods achieve 85% to 95% accuracy in locating productive aquifers. Success rates depend on geological complexity, instrument quality, operator expertise, and seasonal conditions. Multi-method surveys with borehole validation provide the highest reliability.
Q2.How deep can a groundwater survey detect water?
Detection depth depends on the method and array configuration. Standard ERS surveys reach 100 to 500 meters. Specialized deep-sounding methods extend to 800+ meters. Shallow GPR surveys resolve features to 30 meters. The practical limit for most groundwater exploration falls between 50 and 300 meters.
Q3.Can ERS distinguish between clay and groundwater?
Electrical resistivity alone cannot reliably separate clay from freshwater. Both produce low-resistivity signatures. Combining ERS with induced polarization (IP) solves this ambiguity. Clay shows high chargeability. Freshwater-saturated sand shows low chargeability. This dual-parameter approach clarifies interpretation significantly.
Q4.How long does a groundwater survey take?
A typical site survey requires one to three field days. This includes setup, data acquisition, and preliminary quality checks. Data processing and interpretation add two to five office days. Large or complex sites may require additional time. Rush reporting is possible for urgent projects.
Q5.What equipment is needed for a groundwater survey?
Essential equipment includes a multi-channel resistivity meter, electrode cables with switching units, stainless steel electrodes, GPS receiver, and processing software. Optional additions include IP measurement capability, GPR unit, and seismic refraction kit. Geotech provides integrated systems covering all these requirements.