Welcome to Geotech!
-1.png)


What is Electrical Resistivity Tomography (ERT)? | Comprehensive Guide
TIPS:Electrical resistivity tomography maps underground structures without a single drill hole. This guide explains how electrical resistivity tomography works, from electrode arrays to 3D inversion, and how Geotech ERT systems deliver precise subsurface images for mineral, environmental, and engineering surveys.
Ⅰ. What Is Electrical Resistivity Tomography?
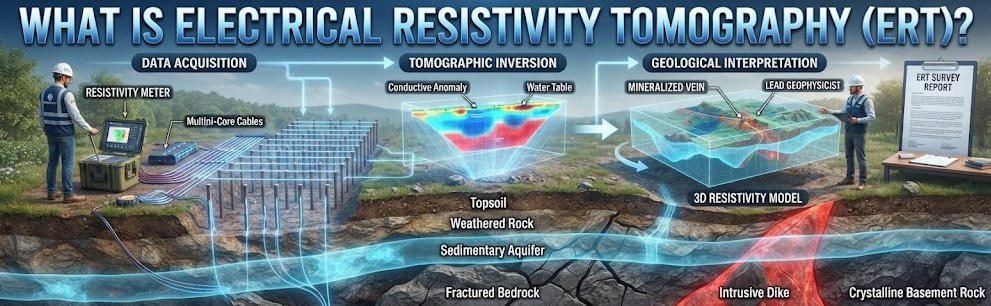
Electrical resistivity tomography is a geophysical imaging method. It maps how rocks and soils conduct electricity beneath the surface. The result is a 2D cross-section or a 3D volume of subsurface resistivity.
Different materials show different resistivity values. Fresh granite resists current. It shows high resistivity above 1,000 Ω·m. Wet clay conducts well. It shows low resistivity below 50 Ω·m. Water-filled fractures sit between these extremes. This contrast creates the images that ERT produces.
ERT does not need drilling. It does not disturb the ground. Electrodes placed on the surface or in boreholes do all the work. A typical survey covers 200 × 200 meters in a single day.
The method works like a medical CAT scan. But instead of X-rays, it uses electrical current. Instead of the human body, it images the earth beneath your feet.
Ⅱ. How ERT Works: The Physics
1.Ohm’s Law in the Ground
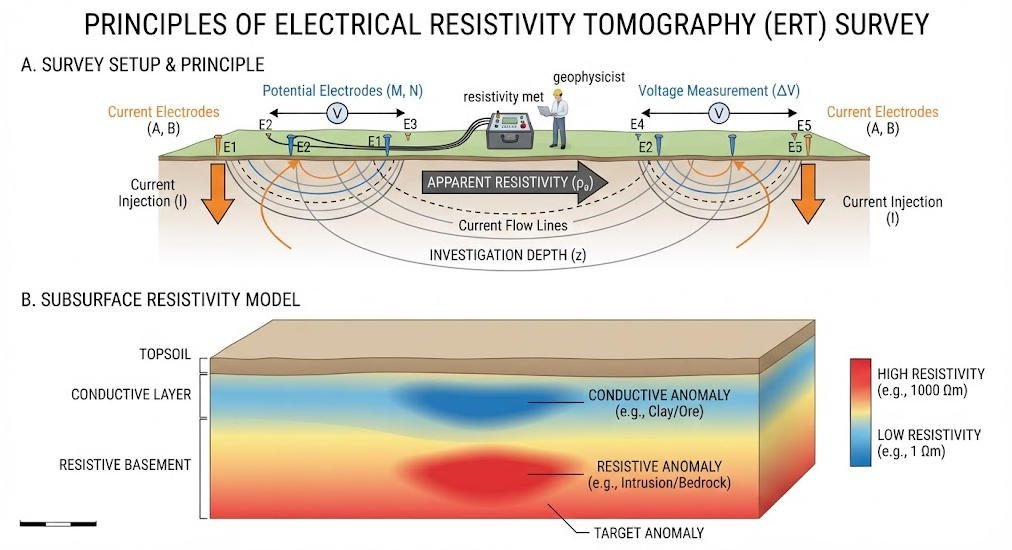
ERT applies direct current to the ground. It uses two current electrodes. The current flows through the subsurface. Two potential electrodes measure the resulting voltage.
Ohm’s Law governs the measurement:
R = ΔV / I
Where R is resistance, ΔV is voltage difference, and I is current. But resistance alone does not tell the full story. Electrode spacing and arrangement matter too.
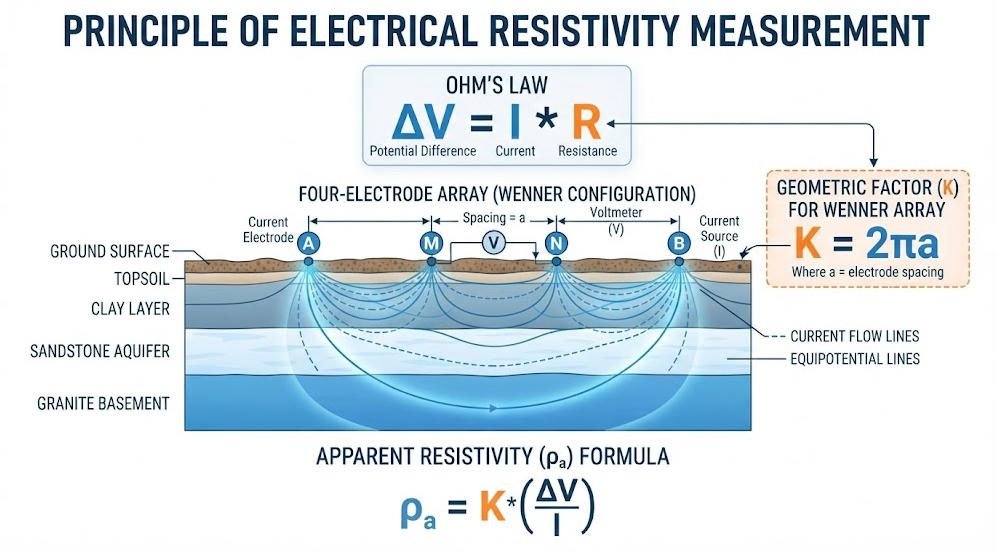
Apparent resistivity adds the geometry factor:
ρa = k × ΔV / I
Where ρa is apparent resistivity and k is the geometric factor. The value of k depends on the electrode array type and spacing. Wenner arrays use k = 2πa. Schlumberger arrays use a more complex formula based on inner and outer spacing.
2.From Apparent to True Resistivity
Apparent resistivity is a weighted average. It blends the resistivity of all materials between the electrodes. It does not show true layer values directly.
Inversion software solves this problem. It compares measured data to theoretical models. It adjusts the model until the fit is optimal. The output is a true resistivity cross-section.
Modern inversion uses smoothness-constrained least-squares algorithms. These produce geologically realistic models. They avoid over-interpreting noise. Structure-coupled inversion with L1-norm regularization sharpens boundaries. It makes edges of cavities and faults clearer.
Ⅲ. Electrode Arrays: Choosing the Right Configuration
ERT supports multiple electrode configurations. Each has strengths and weaknesses.
Wenner Array: Four equally spaced electrodes. Current flows through the outer pair. Voltage measures across the inner pair. This array offers excellent vertical resolution. It works best in homogeneous ground. It is the default choice for layered geology and groundwater surveys.
Schlumberger Array: Inner potential electrodes stay fixed. Outer current electrodes expand. This array reaches deeper with less cable. It is ideal for deep bedrock mapping and regional aquifer studies.
Dipole-Dipole Array: Paired current electrodes and paired potential electrodes. This array detects lateral changes well. It maps steeply dipping faults and vertical fractures. Signal strength drops faster with depth than Wenner.
Combined Array: Runs multiple configurations in one deployment. It captures both vertical layering and lateral boundaries. Recent field studies show combined arrays improve anomaly detection by 30% over single arrays.
Geotech’s GIM-5 Multi-channel Resistivity & IP Meter supports 18 array types. Crews switch between Wenner, Schlumberger, and dipole-dipole without moving electrodes.
Ⅳ. ERT System Components
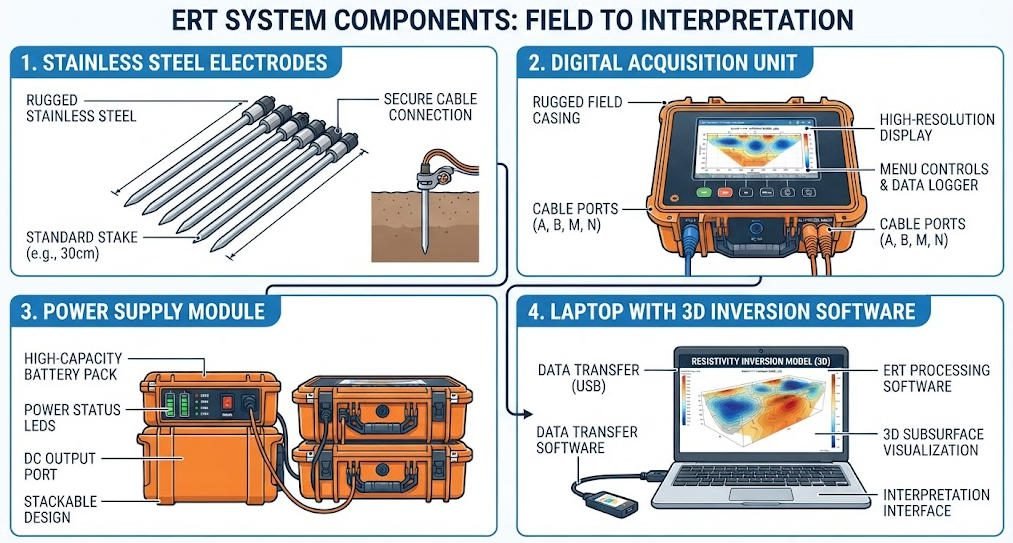
A complete ERT system has four parts.
1.Electrode Array
Stainless steel electrodes penetrate the ground. Spacing ranges from 1 to 20 meters. Smaller spacing gives higher resolution. Larger spacing probes deeper. Geotech’s WGMD-9 array system uses adjustable spacing from 5 to 20 meters.
2.Data Acquisition Unit
The acquisition unit controls current injection and voltage measurement. It needs high precision. Geotech’s WDAS-3 digital unit uses 24-bit analog-to-digital conversion. It achieves 0.1 mV accuracy. This precision matters when measuring weak signals from deep targets.
3.Power Supply
Current must overcome ground resistance. A powerful transmitter pushes current deeper. Geotech’s WDF-5 power module delivers 800 V at 5 A. This is enough for most engineering and mineral surveys. For deep targets, the WGMD-10X reaches 1,100 V and 6 A.
4.Analysis Software
Raw data means nothing without inversion. GeoERT Pro software runs 3D nonlinear inversion. It handles smoothness-constrained and structure-coupled algorithms. It exports results to Res2DInv, EarthImager, and industry-standard formats.
Ⅴ. Three Survey Modes: Surface, Cross-Hole, and Underwater
1.Surface ERT
Surface ERT is the most common mode. Electrodes deploy in a line or grid on the ground. A linear array produces a 2D cross-section. A grid array produces a 3D volume.
The method works in fields, forests, and urban lots. It needs flat or gently sloping terrain. Surface slopes above 15° can distort current flow. Terrain correction algorithms fix mild slopes. Steep terrain may need cross-hole methods instead.
2.Cross-Hole ERT
Cross-hole ERT places electrodes in boreholes. Current flows between holes. Voltage measurements build inter-well images. This mode overcomes surface obstacles. It works where terrain is too steep for surface arrays. It also reaches beneath buildings and roads.
A European landfill used cross-hole ERT. Electrodes in multiple boreholes surrounded the waste cell. 3D inversion mapped conductive plumes escaping the liner. The resolution reached 0.3 meters. Traditional surface methods achieved only 1.2 meters.
3.Underwater ERT
Underwater ERT surveys riverbeds, lake bottoms, and coastal zones. Electrodes mount on a cable dragged across the sediment. The method maps buried channels, pipelines, and archaeological features beneath water.
Geotech’s marine-compatible systems use waterproof electrode cables. They operate at depths up to 100 meters. The WGMD-10X supports underwater and rolling measurement modes.
Ⅵ. Key Advantages and Real Limitations
Advantages
- Non-invasive: No drilling, no excavation, no site disturbance
- Rapid coverage: 200 × 200 m area per day with automated systems
- Real-time imaging: Data refresh rate under 5 seconds on WGMD-10X
- Depth flexibility: Detects targets from 0.5 m to 300 m
- Cost efficiency: 60% lower cost than seismic surveys for shallow targets
Limitations
- Depth ceiling: Standard surface arrays reach 300 m maximum
- Terrain constraints: Slopes above 15° need correction or alternative methods
- Noise sensitivity: Power lines, metal fences, and buried pipes create interference
- Resolution trade-off: Smaller spacing improves resolution but reduces depth
- Non-uniqueness: Multiple geological models can fit the same data
Understanding these limits helps you plan realistic surveys. Always integrate ERT with borehole data for calibration.
Ⅶ. ERT vs. High-Density Resistivity Method
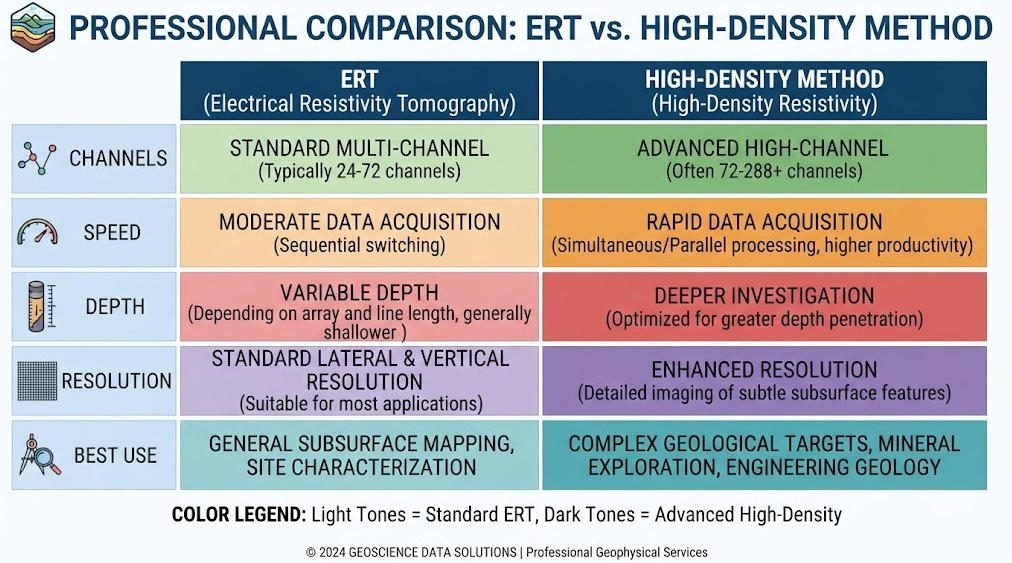
ERT and high-density resistivity share the same physics. Both use multiple electrodes and automated switching. The difference lies in application scope and hardware scale.
| Parameter | ERT | High-Density Method |
|---|---|---|
| Electrode Channels | 32–64 typical | 128–512 typical |
| Survey Speed | 200 points/hour | 1,000 points/hour |
| Depth Range | 0.5–300 m | 0.1–100 m |
| Resolution | 0.5 m | 0.1 m |
| Best For | 3D volume mapping | Rapid 2D profiling |
| Recommended Device | WGMD-9 | WGMD-10V |
ERT excels at complex 3D geology. High-density methods excel at rapid linear surveys. Many projects use both. A high-density screen identifies target zones. Follow-up ERT maps them in 3D.
Ⅷ. Field-Proven Applications
1.Mineral Exploration
A California gold project deployed the WGMD-10X system. Crews laid 1,200 electrodes across a mountain slope. Eight hours of acquisition mapped an 800-meter continuous low-resistivity zone. Values dropped below 50 Ω·m. Drilling verified the ERT model. Gold vein thickness errors stayed below 8%. Survey duration dropped from 45 days to 12 days.
2.Highway Engineering
Cross-hole high-density ERT mapped a highway corridor. Electrode spacing was 0.5 meters. Anomaly positioning accuracy reached ±0.2 meters. This was 65% better than traditional methods. Engineers used the data to avoid voids and weak zones during tunnel construction.
3.Environmental Monitoring
Time-lapse ERT tracks contaminant plumes over months or years. A single baseline survey establishes the starting condition. Repeat surveys reveal how plumes move. This guides remediation design and validates cleanup progress.
4.Groundwater Exploration
Freshwater aquifers show high resistivity. Saltwater intrusion shows low resistivity. ERT delineates the boundary between them. Coastal communities use this data to manage well fields and prevent over-pumping.
Related Articles
Explore related Geotech resources for your geophysical projects:
- Underground Electrical Exploration Methods Compared
- Comparative Study of Geophysical Exploration Methods: HDR, DC Sounding & ERT
- ERT vs TEM: Which Geophysical Method Fits Your Project?
- Induced Polarization Method for Mineral Exploration
- Geophysical Exploration Classification & Applications
- What Is an ERT Instrument? A Comprehensive Guide
- WGMD-10X Multi-Channel High-Density System
- GIM Series Intelligent Resistivity & IP Meter
Reference Sources
| Authority | Source URL |
|---|---|
| U.S. Environmental Protection Agency (EPA) — Electrical Resistivity | https://www.epa.gov/environmental-geophysics/electrical-resistivity |
| Society of Exploration Geophysicists (SEG) | https://seg.org/ |
| Society of Environmental & Engineering Geophysicists (EEGS) | https://www.eegs.org/ |
| National Center for Biotechnology Information (NCBI/PMC) — ERT Applications | https://pmc.ncbi.nlm.nih.gov/articles/PMC10039044/ |
| Geotech Instrument Co., Ltd. — ERT Instruments Guide | https://geotechcn.net/service/ert-instruments/ |
FAQ
Q1: What is the difference between ERT and DC resistivity sounding?
A: DC sounding uses four electrodes moved manually between points. It builds 1D vertical profiles. ERT uses automated switching across many fixed electrodes. It creates 2D cross-sections or 3D volumes. ERT is faster, higher resolution, and requires less labor.
Q2: How deep can electrical resistivity tomography reach?
A: Standard surface ERT reaches 0.5 to 300 meters. Depth depends on electrode spacing and transmitted power. The rule of thumb is: maximum depth equals total array length divided by three to five. Cross-hole ERT can extend deeper using borehole electrodes.
Q3: Which electrode array is best for karst detection?
A: The Wenner array is the default choice for karst surveys. It provides excellent vertical resolution. It clearly shows the “beads-on-a-string” pattern of air-filled cavities above water-filled fills. Combined Wenner-Schlumberger arrays add lateral detail for complex karst networks.
Q4: Can ERT detect contaminant plumes in real time?
A: ERT does not detect chemicals directly. It detects the electrical signature of contaminated water. High-concentration salt or leachate plumes show very low resistivity. Time-lapse ERT tracks plume movement over weeks or months. It is a powerful monitoring tool when combined with groundwater sampling.
Q5: Why does ERT data need inversion software?
A: Raw ERT data shows apparent resistivity. This is a weighted average of all materials between electrodes. It does not show true layer values. Inversion software compares measured data to theoretical models. It finds the geological model that best fits the data. Without inversion, you cannot interpret subsurface structures accurately.